Facebook
 X
X
 Pinterest
 Copy Link
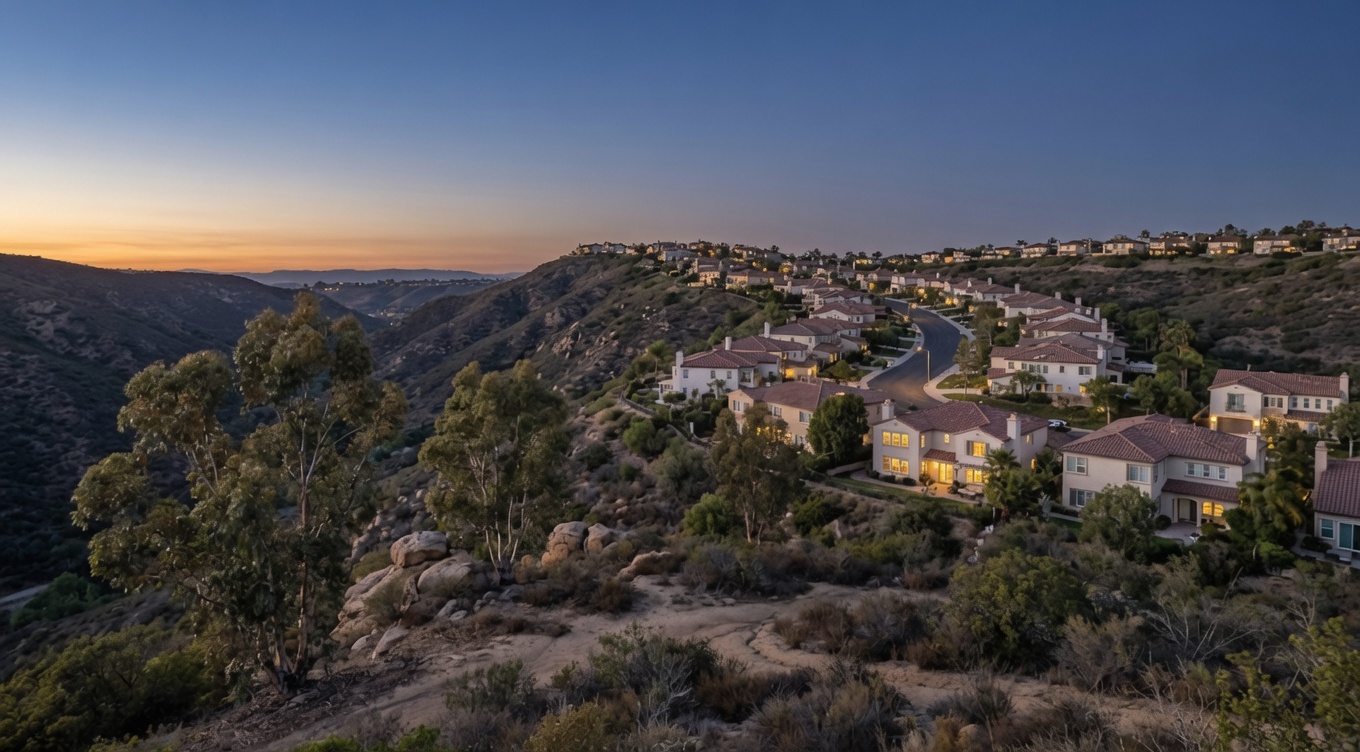
Anaheim Hills Housing Market: July 2026 Results
Quick Answer
The Anaheim Hills housing market recorded 18 closed sales in July 2026, totaling $25,381,000. The median sale price was $1,405,000, and sellers averaged 100.1% of original list in about 25 days. In short, the typical home finished right about where it launched.
Market data as of August 4, 2026. Closed figures cover July 2026 closings in Anaheim Hills. Those figures are based on CRMLS data via Pacific West Association of Realtors (as of August 4, 2026). Analysis by Michael Mellgren, REALTOR® (DRE #02321556).
What happened in the Anaheim Hills housing market in July 2026?
Anaheim Hills closed 18 sales in July 2026 for $25,381,000 in volume. The median was $1,405,000 and the average $1,410,056. Homes averaged 24.8 days on market, the stretch from listing to accepted offer.
Sellers averaged 100.1% of original list price. That ratio, sale-to-list, measures the close against a home’s launch price rather than any later cut. Anything at or above 100% means the average seller held the opening number.
Median and average sat only $5,056 apart, a tight spread for a month this small. One July closing recorded at $3,250,000. It did not drag the average up, because four homes also closed between $810,000 and $980,000. The two ends offset each other.
Anaheim Hills also read stronger in July than in the two months before it. Sellers averaged 99.9% of original list in May 2026, 97.8% in June, and 100.1% in July. Average days on market ran 25.1, then 34.2, then 24.8. Three months make a short run, not a trend, and the Anaheim Hills June 2026 market results covers that softer middle month.
Did Anaheim Hills home prices really jump 25% in a year?
No, and the distance between two figures shows why. The Anaheim Hills median rose 25.4% against July 2025, from $1,120,000 to $1,405,000. The average, though, rose just 6.7%, from $1,321,475 to $1,410,056.
A median tracks the middle of the month. A move that large usually points to which homes sold, rather than to a 25% gain in value across Anaheim Hills.
The mix explains it directly. In July 2025, 8 of 20 Anaheim Hills closings landed under $1,000,000, and three finished below $750,000. In July 2026, only 4 of 18 closed under $1,000,000, and none sold below $750,000. The bottom of the month emptied out, which lifted the middle without lifting any single home.
Meanwhile the top end did not carry the month either. July 2025 recorded four closings above $2,000,000, including one at $3,675,000. This July recorded a single sale above that mark, at $3,250,000. Closings fell 10.0% year over year and volume fell 4.0%, so Anaheim Hills sold fewer homes for slightly less overall.
Two figures did improve on their own terms. Sellers averaged 100.1% of original list in July 2026, against 98.9% in July 2025. Average days on market fell from 27.9 to 24.8. Both are ratios rather than price levels, so a shift in what sold moves them far less.
Still, one month is a single reading rather than a direction. The Anaheim Hills housing market Q2 2026 results covers the wider April to June cohort.
Which Anaheim Hills price range sold fastest in July 2026?
The $1.5M–$2M band moved fastest in Anaheim Hills in July 2026. It averaged 17.8 days on market across five sales at 101.6% of original list. It was also the only band in the city to finish above asking for the month.
The busiest band sat directly beneath it and behaved differently. The $1M–$1.5M range produced 8 of the month’s 18 closings in Anaheim Hills. That band accounted for $10,241,000 of the $25,381,000 total, roughly 40% of volume.
Yet it averaged 29.9 days and 99.5% of original list. Put plainly, the range with the most buyers was not the range with the most urgency.
| Price band | Sales | Volume | Avg. price | Avg. days on market | Avg. sale-to-list |
|---|---|---|---|---|---|
| $750K–$1M | 4 | $3,690,000 | $922,500 | 21.8 | 99.9% |
| $1M–$1.5M | 8 | $10,241,000 | $1,280,125 | 29.9 | 99.5% |
| $1.5M–$2M | 5 | $8,200,000 | $1,640,000 | 17.8 | 101.6% |
| $2M+ | 1 | $3,250,000 | $3,250,000 | 31.0 | 98.5% |
Anaheim Hills home sales by price band, July 2026 closings. The $750K–$1M and $2M+ rows rest on fewer than five sales, so their averages describe those specific homes rather than a price range. Source: CRMLS via Pacific West Association of Realtors; analysis by Michael Mellgren, REALTOR®.
Two rows in that table rest on very few homes. They describe those specific properties rather than a price range. The $750K–$1M band covers four sales. The $2M+ row covers a single closing at $3,250,000, which took 31 days and closed at 98.5%.
What is the Anaheim Hills housing market doing right now?
As of August 4, 2026, Anaheim Hills held an Expected Market Time of 53 days. That reading grades as a Deep Seller’s Market. Expected Market Time estimates how long selling every active listing would take at the current pace of escrows. A lower number signals tighter supply.
Demand shows in the pipeline as well. Anaheim Hills carried 39 active listings against 24 homes in escrow. That puts 38.1% of the market under contract. The North Orange County housing market roundup sets the city against the wider region as mortgage rates have climbed.
Asking prices, however, sit well ahead of what escrows are clearing. Within matched price segments, active Anaheim Hills listings average $1,433,342. Homes in escrow are clearing $1,240,955, a gap of $192,387, or 13.4%. That spread is the sharpest warning here, because sellers as a group are asking more than the pipeline pays.
Few sellers have answered it yet. Of the 39 active Anaheim Hills listings, 29 still hold within 1% of their original price. Another 8 have trimmed between 1% and just under 5%, and 2 have cut 5% or more. Only 10 listings have adjusted at all.
| Measure | Reading |
|---|---|
| Active listings | 39 |
| Homes in escrow | 24 |
| Share of market under contract | 38.1% |
| Expected Market Time | 53 days (Deep Seller’s Market) |
| Average active asking price (band-adjusted) | $1,433,342 |
| Average clearing price in escrow (band-adjusted) | $1,240,955 |
| Actives holding within 1% of original list | 29 |
| Actives trimming 1% to just under 5% | 8 |
| Actives cutting 5% or more | 2 |
Anaheim Hills live market snapshot as of August 4, 2026. Source: CRMLS via Pacific West Association of Realtors; analysis by Michael Mellgren, REALTOR®.
What July 2026 means for Anaheim Hills buyers and sellers
For sellers, the July record argues that the launch price does most of the work in Anaheim Hills. Homes averaged 100.1% of original list. Listings priced to the closed record cleared at roughly the number they opened with, in about 25 days. The 13.4% asking-to-escrow gap makes the same point from the other side.
For buyers in Anaheim Hills, leverage sits in the asking prices rather than in the closed record. A 53-day Expected Market Time and 38.1% under contract leave little room to wait out a well-priced home. Even so, active asking runs $192,387 above what escrows clear. Two listings have already cut 5% or more, so negotiating room concentrates in homes that opened high.
Anaheim Hills housing market FAQ
Is now a good time to sell in Anaheim Hills?
Conditions favored sellers in Anaheim Hills through July 2026. Sellers averaged 100.1% of original list price across 18 closings that month, in about 25 days. As of August 4, 2026, the city held a 53-day Expected Market Time, with 38.1% under contract. The live risk is pricing rather than demand, since active asking averages 13.4% above escrow prices.
Are home prices rising or falling in Anaheim Hills?
Anaheim Hills prices read broadly steady through July 2026 rather than sharply higher. The July median of $1,405,000 sat 25.4% above July 2025. The average, though, rose only 6.7% over the same span. Most of the median’s move came from which homes sold, not from across-the-board appreciation.
How long does it take to sell a home in Anaheim Hills?
Homes that closed in Anaheim Hills in July 2026 averaged about 25 days on market. That counts listing to accepted offer, with escrow adding several more weeks before the sale records. The live market as of August 4, 2026 carried a 53-day Expected Market Time. That figure measures current supply against the pace of new escrows, not the speed of homes already sold.
Is now a good time to buy in Anaheim Hills?
Buyers in Anaheim Hills had limited but real leverage as of August 4, 2026, concentrated in listings that launched high. Active asking averaged $192,387, or 13.4%, above what escrow homes were clearing within matched segments. Of 39 active listings, 10 had already reduced, including 2 that cut 5% or more. Supply stayed tight, though, at a 53-day Expected Market Time.
Price an Anaheim Hills home against the July record
Whether an Anaheim Hills home should launch at $1.4 million or at $1.25 million depends on one address. The comparison that settles it is the 18 homes that actually closed in July 2026. Michael Mellgren, REALTOR®, tracks every closed Anaheim Hills sale as it records. He can set a property against those closings, its price band, and the current asking-to-escrow gap.
Run a specific Anaheim Hills address against these closings before the launch price is set, not after the first reduction. Email Michael Mellgren about the Anaheim Hills market, or call or text (714) 420-6629.
Placentia Housing Market: July 2026 Results
Quick Answer
The Placentia housing market recorded 25 closed sales in July 2026, worth $27,663,490, at a median sale price of $1,100,000. Sellers averaged 98.7% of original list price in about 25 days. Homes now in escrow are clearing 4.3% above current asking, a reversal of the pattern showing up in neighboring cities.
Closed figures cover July 1 through July 31, 2026. Live market data as of August 4, 2026. Figures come from CRMLS data via Pacific West Association of Realtors; analysis by Michael Mellgren, REALTOR® (DRE #02321556).
How did the Placentia housing market perform in July 2026?
Placentia closed 25 home sales in July 2026, totaling $27,663,490 in volume. That is a lighter month than July a year earlier, when 34 homes closed. Even so, the homes that did sell moved faster and held their price.
Sellers averaged 98.7% of original list price. Sale-to-list, often shortened to L/S, measures the final sale price against the first asking price. It captures the whole negotiation, including any cuts along the way. At 98.7%, the typical Placentia seller gave up just over one point from the opening number.
Speed was the month’s strongest reading. Homes averaged 25 days on market, the stretch from listing to going under contract. In July 2025 that same measure ran 37 days, so this July’s homes sold about 12 days quicker.
Why the July median and average landed within $6,540
The median Placentia sale price in July 2026 was $1,100,000, and the average was $1,106,540. Those two figures sit only $6,540 apart, which is unusually tight for a single month. When they diverge, it normally means one price tier is pulling the arithmetic.
Here neither end did. Of the 25 closings, 22 landed between $750,000 and $1.5 million. Only two sold below $750,000 and one above $1.5 million, so almost no weight sat at either extreme to skew the average.
That matters for anyone pricing a home. A citywide median usually needs a caveat about what happened to sell. In July 2026, the Placentia median describes the actual middle of the market instead.
Placentia home sales by price band (July 2026)
The table below splits Placentia’s July 2026 closings into four price bands. Every band appears with its own averages, including the two thin ones, so the full month stays visible rather than partly blanked out.
| Price band | Sales | Volume | Avg. price | Avg. days on market | Avg. sale-to-list |
|---|---|---|---|---|---|
| Under $750K | 2 | $1,179,500 | $589,750 | 22 | 100.6% |
| $750K–$1M | 8 | $7,054,990 | $881,874 | 27 | 95.7% |
| $1M–$1.5M | 14 | $17,529,000 | $1,252,071 | 26 | 100.1% |
| $1.5M–$2M | 1 | $1,900,000 | $1,900,000 | 6 | 95.2% |
Placentia home sales by price band, July 2026. Source: CRMLS via Pacific West Association of Realtors; analysis by Michael Mellgren, REALTOR®. The under-$750K row rests on two sales and the $1.5M–$2M row on one, so those averages describe those specific homes rather than a market pace. Average sale-to-list is computed on the 24 of 25 closings carrying a valid original list price; one record in the $750K–$1M band held a corrupt original-list entry in the source data and was excluded.
Where the discount actually showed up in July
Negotiating room in Placentia sat in one band in July 2026, not across the market. Homes between $750,000 and $1 million closed at 95.7% of original list, while homes between $1 million and $1.5 million closed at 100.1%.
Speed does not explain that gap. The $750K to $1M band averaged 27 days and the $1M to $1.5M band averaged 26, so both cleared at essentially the same pace. The difference came from price, not patience.
The $1M to $1.5M band also carried the month on volume, with 14 of the 25 closings and $17,529,000 of the $27,663,490 total, roughly 63%. A citywide Placentia figure is mostly a report on that one band.
Meanwhile the single $1.5M to $2M sale closed in six days at 95.2% of original list. Both of those numbers come from one house, so neither describes a Placentia pace.
How July 2026 compared with July 2025 in Placentia
Placentia closed fewer homes than a year earlier without giving up price. Closings fell 26.5%, from 34 to 25, and volume fell 20.3%, from $34,714,137 to $27,663,490. The median rose 1.6%, from $1,082,500 to $1,100,000.
Sale-to-list held nearly flat too, at 98.7% against 98.9% in July 2025. Average days on market, by contrast, improved from 37 to 25. Fewer buyers transacted, yet the ones who did moved quickly and paid close to asking.
A month measured against the same month a year earlier is a clean comparison, though it stays a single reading. At 25 sales, a handful of transactions can move any percentage above. For the two nearest comparison periods, see the Placentia June 2026 market results and the Placentia Q2 2026 market results.
What the live Placentia housing market looks like right now
Placentia held 54 active listings and 28 homes in escrow on August 4, 2026, putting 34.1% of the market under contract. That escrow pipeline carries $30,898,779, and 25 of the 28 homes went pending within the previous 30 days.
Expected Market Time stood at 65 days, a moderate seller’s market. The measure estimates how long current inventory would take to sell at the present pace of new escrows. Anything under 90 days favors sellers. At 65 days, Placentia sits on the seller side without being frantic.
One live number points the other way from the region. Within matched price segments, Placentia escrows are clearing $42,839 above current asking, about 4.3%. That figure runs the opposite direction across most of the nearby markets covered in the North Orange County housing market roundup. There, asking prices sit above what escrows actually clear.
In plain terms, Placentia list prices are not ahead of the market. That is the opposite of an overpricing signal, and it is the strongest argument in this month’s data for listing rather than waiting.
Seller pricing posture agrees. Of the 54 active listings, 33 remain within 1% of their original price. Another 13 have trimmed 1% to just under 5%, and 8 have cut 5% or more. That last group is 38% of the 21 listings that have adjusted at all, which is worth watching rather than acting on.
Placentia housing market FAQ
Is now a good time to sell a home in Placentia?
July 2026 supports listing in Placentia. Sellers averaged 98.7% of original list price in about 25 days. Expected Market Time held at 65 days on August 4, 2026, with 34.1% of the market under contract. Current escrows are also clearing about 4.3% above asking, so list prices are not running ahead of buyers.
Are Placentia home prices rising or falling?
Placentia home prices edged up. The July 2026 median was $1,100,000, about 1.6% above the $1,082,500 median of July 2025. One month is a single reading, not a trend. July 2026 also carried only 25 closings, so this points to firmness rather than a confirmed climb.
How long does it take to sell a home in Placentia?
Homes in Placentia averaged 25 days on market in July 2026, measured from listing to going under contract. That improved on the 37-day average of July 2025. Expected Market Time across current inventory stood at 65 days as of August 4, 2026.
Which Placentia price range was most active in July 2026?
Homes between $1 million and $1.5 million dominated. That band produced 14 of the 25 July closings and $17,529,000 of the month’s $27,663,490 in volume. It also closed at 100.1% of original list in about 26 days.
How much inventory is on the market in Placentia right now?
Placentia carried 54 active listings on August 4, 2026, with 28 more homes already in escrow. Among those active listings, 33 were holding within 1% of original price. Another 13 had trimmed 1% to just under 5%, and 8 had cut 5% or more.
What the July numbers mean for a specific Placentia address
A 25-sale month gives Placentia a clear citywide reading. Even so, the band a home sits in swung the July outcome by more than four percentage points. Michael Mellgren, REALTOR®, tracks every closed Placentia sale first-hand. He can pull the band-level pricing, speed, and negotiation picture for any address under consideration.
Pin down which price band an address actually falls in before setting the number, not after the first round of showings. Email Michael Mellgren about the Placentia market, or call or text (714) 420-6629. For figures tied to an actual purchase or sale, consult a qualified tax or lending professional.
Orange Housing Market: July 2026 Results
Quick Answer
The Orange housing market recorded 76 closed sales in July 2026 at a median price of $1,182,313. Sellers averaged 97.9% of their original list price in about 32 days, on $94,347,830 in total volume. Homes between $1 million and $1.5 million carried the month, taking 42 of the 76 closings.
Closed figures cover July 2026 closings in Orange. Market data as of August 3, 2026, based on CRMLS data via Pacific West Association of Realtors; analysis by Michael Mellgren, REALTOR® (DRE #02321556).
What happened in the Orange housing market in July 2026?
Orange closed 76 sales in July 2026, down 2.6% from the 78 that closed in July 2025. Volume slipped 1.1% to $94,347,830. The median sale price rose 1.9% to $1,182,313. That is a clean month-against-month comparison, though one month is a single reading rather than a trend.
Sellers gave back some ground on price. Across the month, Orange homes closed at an average of 97.9% of original list price.
Sale-to-list measures the closing price against the very first price a home asked, so it captures every reduction along the way. Any figure below 100% means the typical seller finished under the number the listing opened with. In July, that gap ran about 2.1 percentage points.
Speed moved the same direction. Homes averaged 32 days on market, which counts the stretch from listing to sale. Meanwhile the average sale price reached $1,241,419, roughly $59,000 above the median, so the upper bands pulled the arithmetic slightly.
What did homes sell for in Orange in July 2026?
The middle of the market carried the month. Homes between $1 million and $1.5 million took 42 of July’s 76 closings and $51,186,948 of the volume. They cleared in about 26 days at 98.8% of original list. No other band came close on either count.
| Price band | Sales | Volume | Avg. price | Avg. days on market | Avg. sale-to-list |
|---|---|---|---|---|---|
| Under $750K | 6 | $3,409,000 | $568,167 | 80 | 97.5% |
| $750K–$1M | 15 | $13,977,050 | $931,803 | 25 | 98.2% |
| $1M–$1.5M | 42 | $51,186,948 | $1,218,737 | 26 | 98.8% |
| $1.5M–$2M | 10 | $17,674,832 | $1,767,483 | 33 | 96.5% |
| $2M+ | 3 | $8,100,000 | $2,700,000 | 60 | 89.1% |
Orange home sales by price band, July 2026 closings. The under-$750K band covers six closings and the $2M+ band three, so those averages describe individual homes rather than price tiers. Source: CRMLS via Pacific West Association of Realtors; analysis by Michael Mellgren, REALTOR®.
The edges of the market behaved nothing like the middle. Under $750,000, six Orange homes averaged 80 days, and two of those sat 154 and 195 days before closing. Above $2 million, three sales averaged 60 days at 89.1% of original list, with one closing 18.8 points under its opening ask after 134 days.
Those thin bands are worth reporting and not worth leading on. Six sales and three sales describe those specific homes. By contrast, the $750,000 to $1.5 million range produced 57 of the month’s 76 closings and moved in about 26 days.
How close to asking did Orange sellers get in July 2026?
Every price band in Orange closed below 100% of original list price in July 2026. The $1 million to $1.5 million band came closest at 98.8%. Next were $750,000 to $1 million at 98.2% and under $750,000 at 97.5%. The two upper bands trailed, at 96.5% between $1.5 million and $2 million and 89.1% above $2 million.
That reading is softer than the two months before it. Orange sellers averaged 100.5% of original list in May and 99.7% in June, while average days on market ran 21, then 27, then 32. Three consecutive months moving the same way is worth watching, though three months is still a short run.
One comparison cuts the other way. In July 2025, Orange sellers averaged 96.5% of original list price, so this July finished 1.4 points ahead of the same month a year ago. A softer summer is not new to this market.
What does the Orange housing market look like right now?
As of August 3, 2026, Orange held 147 active listings against 75 homes in escrow. That puts 33.8% of the market already under contract. Expected Market Time stood at 58 days, a Deep Seller’s Market. The measure estimates how long current inventory would take to clear at the recent pace of escrows.
| Measure | Reading |
|---|---|
| Active listings | 147 |
| Homes in escrow | 75 ($100,197,324) |
| Share of market under contract | 33.8% |
| Expected Market Time | 58 days (Deep Seller’s Market) |
| Average asking price (band-adjusted) | $1,303,642 |
| Average escrow clearing price (band-adjusted) | $1,304,412 |
| Actives holding within 1% of original list | 91 |
| Actives trimmed 1% to under 5% | 42 |
| Actives cut 5% or more | 14 |
Orange live market snapshot as of August 3, 2026. Source: CRMLS via Pacific West Association of Realtors; analysis by Michael Mellgren, REALTOR®.
Asking prices and escrow prices sit almost exactly on top of each other. On a band-adjusted basis, active asking averaged $1,303,642 against $1,304,412 for homes clearing escrow, a gap under a tenth of a percent. Orange sellers as a group are not priced ahead of the market.
The price-cut posture points the same way. Of the 56 Orange listings that have adjusted, 14 have cut 5% or more. That is 25% of all adjusted homes, and the other 42 made smaller trims under 5%.
A trim under 5% usually just means a home found the market. Deeper cuts are the earlier signal, and the question is whether that 25% share grows.
What July 2026 means for Orange buyers and sellers
The Orange housing market in July 2026 still favored sellers, even as the closed record cooled. Homes cleared at 97.9% of original list, the softest monthly reading since February. Yet Expected Market Time held at 58 days, and asking and escrow prices sat at parity.
Sellers should read the band rather than the headline. A home between $1 million and $1.5 million met a market that absorbed 42 sales in about 26 days. A home under $750,000 or above $2 million met a much slower one, at roughly 80 and 60 days.
Buyers have leverage in specific places instead of across the board. The upper bands gave the most ground in July, at 96.5% between $1.5 million and $2 million and 89.1% above $2 million. Citywide, though, only 14 of 147 active listings have cut 5% or more, so discounts are far from general.
Both readings land in the same place. In Orange, the price band shapes the negotiation more than the calendar does. So the useful question is never what the citywide median did last month. It is what a specific address, in a specific band, would clear today.
Related reading covers the Orange housing market Q2 2026 results and the Orange housing market June 2026 results. The city’s standing against nine neighboring markets appears in the North Orange County housing market roundup.
Orange housing market FAQ (July 2026)
Is now a good time to sell a home in Orange?
July 2026 stayed favorable for Orange sellers, though less so than the spring. Homes closed at an average of 97.9% of original list price in about 32 days. As of August 3, 2026, the market held an Expected Market Time of 58 days, with 33.8% of listings under contract. That grades as a Deep Seller’s Market.
Are Orange home prices rising or falling?
Orange’s median sale price was $1,182,313 in July 2026, up 1.9% from July 2025. That is a clean same-month comparison. Even so, a single month reflects what happened to sell as much as what values did, so it reads as one data point rather than a trend line.
How long does it take to sell a home in Orange?
Orange homes that closed in July 2026 averaged 32 days on market. Speed varied sharply by price. The $750,000 to $1.5 million range averaged about 26 days, while the six homes under $750,000 averaged 80 days.
Is now a good time to buy a home in Orange?
Buyers in Orange found selective leverage in July 2026. Every price band closed below original list, and the upper end gave the most, at 96.5% between $1.5 million and $2 million. As of August 3, 2026, 14 of the city’s 147 active listings had cut 5% or more from their original price.
How much inventory is on the Orange market right now?
Orange held 147 active listings as of August 3, 2026. Another 75 homes sat in escrow, representing $100,197,324 in committed volume. Those escrows will set the comparable sales appraisers rely on over the next 30 to 45 days.
Price an Orange address against these July closings
A citywide median tells an Orange owner very little. One range absorbed 42 sales in about 26 days, while six entry-level homes averaged 80. Michael Mellgren, REALTOR®, tracks every closed Orange sale as it records. He can show where a specific address sits inside these July 2026 results, band by band.
Test a target price against July’s band-level record while the home is still off market, so the first week of showings is not the experiment. Email Michael Mellgren about an Orange market question, or call or text (714) 420-6629. For loan terms and current rates, speak with a licensed lender.
Brea Housing Market: July 2026 Results
Quick Answer
The Brea housing market closed 30 sales in July 2026, totaling $38,279,500 in volume, at a median sale price of $1,252,500. Sellers averaged 102.6% of original list price in about 25 days on market. Homes between $1 million and $1.5 million carried the month, accounting for 19 of the 30 closings.
Market data as of August 3, 2026, based on CRMLS data via Pacific West Association of Realtors; analysis by Michael Mellgren, REALTOR® (DRE #02321556).
How did the Brea housing market perform in July 2026?
Brea sellers finished July 2026 above their original asking price, averaging 102.6% of original list. That figure is the sale-to-list ratio, measured against the price a home first listed at. It therefore captures the whole negotiation, including any reduction along the way. Across all 30 July closings, homes averaged about 25 days on market, meaning the time from listing to sale.
Volume for the month reached $38,279,500. Meanwhile the median landed at $1,252,500 and the average at $1,275,983, a spread of only $23,483. Because those two figures sit so close together, no single price tier pulled the month’s arithmetic in its own direction.
Concentration, rather than price, is the defining feature of Brea in July 2026. The $1M–$1.5M band produced 19 of the 30 closings and $23,350,500 of the month’s volume, about 61% of the total. Every other band closed fewer than five homes, so the citywide reading is largely a report on one price range.
What sold in Brea in July 2026, and in which price ranges?
The $1M–$1.5M range carried Brea in July 2026, taking 19 of the 30 closings. Those homes cleared at 102.4% of original list in about 23 days, at an average price of $1,228,974. Every other band closed four homes or fewer, so those averages describe specific properties rather than a market trend.
| Price band | Sales | Volume | Avg. price | Avg. days on market | Avg. sale-to-list |
|---|---|---|---|---|---|
| Under $750K | 4 | $2,490,000 | $622,500 | 47 | 101.2% |
| $750K–$1M | 1 | $925,000 | $925,000 | 41 | 92.5% |
| $1M–$1.5M | 19 | $23,350,500 | $1,228,974 | 23 | 102.4% |
| $1.5M–$2M | 4 | $6,659,000 | $1,664,750 | 18 | 107.5% |
| $2M+ | 2 | $4,855,000 | $2,427,500 | 7 | 103.1% |
Brea home sales by price band, July 2026. Every figure is computed from the individual closings in that band; bands of fewer than five sales reflect those specific homes rather than a market trend. Source: CRMLS via Pacific West Association of Realtors; analysis by Michael Mellgren, REALTOR®.
Two figures in the thin bands are worth naming and worth discounting. The $1.5M–$2M band averaged 107.5% of original list, and the two homes above $2 million closed in seven days. Both readings rest on a handful of sales, so they describe those specific homes rather than the upper end of the Brea market.
The bottom of the market moved on a different clock. Homes under $750,000 averaged 47 days, and the single sale between $750,000 and $1 million took 41 days and finished at 92.5% of original list. Speed in Brea tracked the middle band, not the entry level.
Did Brea home prices rise or fall compared to July 2025?
Brea’s median sale price rose 2.7% against July 2025, from $1,220,000 to $1,252,500. Closings fell 14.3% over the same comparison, from 35 to 30, while volume fell 13.9%, from $44,438,000 to $38,279,500. Month against the same month is a clean comparison, because both windows cover the same stretch of the calendar.
Even so, one month is one reading rather than a trend. Five fewer closings in a market this size can come down to listing timing alone. July’s concentration in a single band also means the median describes a narrow slice of Brea. For context on the fuller cohort, the Brea housing market Q2 2026 results cover 79 closings across April through June.
What does the Brea housing market look like right now?
The Brea housing market held a Deep Seller’s Market as of August 3, 2026, with an Expected Market Time of 56 days. Expected Market Time estimates how long it would take to sell every active listing at the current pace of new escrows. A lower number therefore signals tighter supply. Alongside that, 36.6% of the combined listed and pending market sat under contract.
Inventory stood at 52 active listings against 30 homes in escrow worth $32,255,900. Sellers were largely holding their prices as well. Of those 52 actives, 38 sat within 1% of original list, 10 had trimmed 1% to just under 5%, and 4 had cut 5% or more.
The distance between asking and clearing was narrow. On a band-adjusted basis, active listings averaged $1,060,615 while homes in escrow averaged $1,041,792, a difference of $18,823, or 1.8%. In plain terms, Brea sellers were asking close to what the market was actually paying.
| Live market measure | Reading as of August 3, 2026 |
|---|---|
| Active listings | 52 |
| Homes in escrow | 30 ($32,255,900) |
| Share of market under contract | 36.6% |
| Expected Market Time | 56 days (Deep Seller’s Market) |
| Average asking price, active listings (band-adjusted) | $1,060,615 |
| Average price clearing escrow (band-adjusted) | $1,041,792 |
| Asking-to-escrow gap | $18,823 (1.8%) |
| Actives holding within 1% of original list | 38 |
| Actives trimming 1% to just under 5% | 10 |
| Actives cutting 5% or more | 4 |
Brea live market snapshot, August 3, 2026. Source: CRMLS via Pacific West Association of Realtors; analysis by Michael Mellgren, REALTOR®.
What July 2026 means for Brea buyers and sellers
Sellers should price to the band rather than to the citywide median. A Brea home in the $1M–$1.5M range met 19 comparable July closings that cleared at 102.4% of original list in about 23 days. A home outside that range met only a handful of comparable sales. Its pricing case therefore has to be built address by address.
Buyers face a thin but real leverage picture. Only 4 of 52 active listings had cut 5% or more off original list on August 3, 2026. The 1.8% asking-to-escrow gap also leaves little air in a typical Brea list price. At an Expected Market Time of 56 days, hesitation on a correctly priced home carries a genuine cost.
Context beyond the city line helps on both sides of the table. For the wider regional picture, the North Orange County housing market comparison ranks Brea against nine neighboring markets.
Brea July 2026 market FAQ
Is now a good time to sell a home in Brea?
The July 2026 data favors Brea sellers. Homes closing in Brea that month averaged 102.6% of original list price in about 25 days. As of August 3, 2026, the city also held a Deep Seller’s Market, with an Expected Market Time of 56 days and 36.6% of the market under contract.
Are Brea home prices rising or falling?
Brea’s median sale price rose 2.7% in July 2026 against July 2025, reaching $1,252,500. That is a single-month reading rather than a trend, though. July’s closings were also concentrated in one price band, so the figure is not a broad citywide price movement.
How long does it take to sell a home in Brea?
Homes that closed in Brea during July 2026 averaged about 25 days on market. The live market ran on a comparable footing. As of August 3, 2026, Expected Market Time stood at 56 days, a measure of the whole standing inventory rather than one sale.
Is now a good time to buy a home in Brea?
Buyers in Brea had limited negotiating room entering August 2026. Of the 52 active listings on August 3, 2026, only 4 had cut 5% or more from original list. The band-adjusted gap between asking prices and escrow prices was $18,823, or 1.8%.
How much inventory is on the Brea market right now?
Brea carried 52 active listings as of August 3, 2026. Another 30 homes sat in escrow, representing $32,255,900 in pending volume. Together that places 36.6% of the combined market under contract.
Next steps for a Brea address
July 2026 in Brea turns on which price band an address sits in. The citywide median answers that question for almost no one. Michael Mellgren, REALTOR®, tracks every Brea closing as it records. He can show how a specific property compares to the sales in its own band rather than the city average.
Before settling on a list price, measure the address against the band it actually competes in, not against the citywide median. Email Michael Mellgren about the Brea July 2026 market, or call or text (714) 420-6629. For the prior month, the Brea June 2026 market results cover 31 closings.
Fullerton Housing Market: July 2026 Results
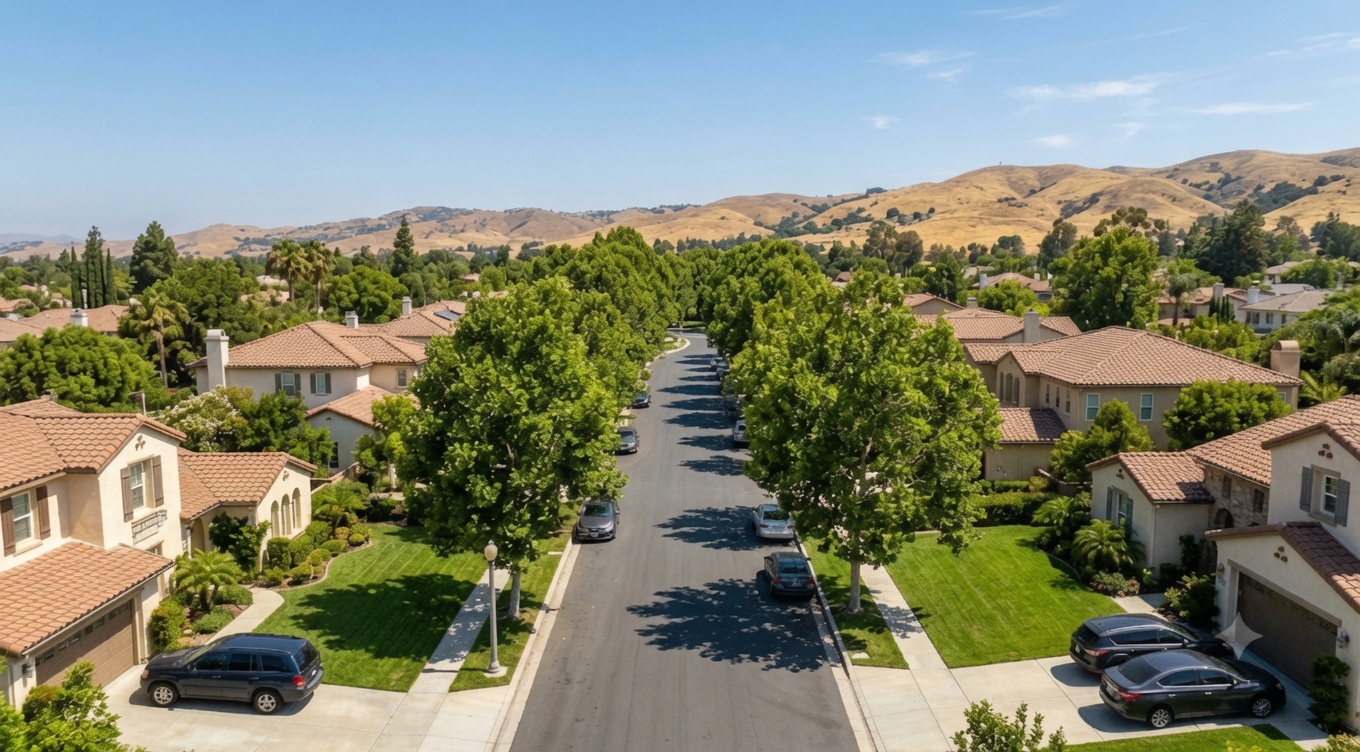
Quick Answer
The Fullerton housing market in July 2026 recorded 71 closed sales at a median price of $1,125,000. Sellers averaged 100.9% of their original list price in about 29 days, on $82,068,388 in total volume. Homes between $1 million and $1.5 million carried the month, taking 30 of the 71 closings.
Closed figures cover July 2026 closings in Fullerton. Market data as of August 3, 2026, based on CRMLS data via Pacific West Association of Realtors; analysis by Michael Mellgren, REALTOR® (DRE #02321556).
What happened in the Fullerton housing market in July 2026?
Fullerton closed 71 sales in July 2026, up 10.9% from the 64 that closed in July 2025. Volume rose 10.3% to $82,068,388. The median sale price gained 5.9% to $1,125,000. That is a clean month-against-month comparison, but a single month is one reading, not a trend.
Sellers held their ground on price. Across the month, Fullerton homes closed at an average of 100.9% of original list price.
Sale-to-list measures the closing price against the very first price a home asked. It therefore captures every reduction along the way. Any figure above 100% means the typical seller finished above where the listing started.
Speed backed that up. Homes averaged 29 days on market, which counts the stretch from listing to sale. The average sale price landed at $1,155,893, only about $31,000 above the median. No small cluster of expensive sales distorted the middle of the market.
What did homes sell for in Fullerton in July 2026?
The middle of the market did the heavy lifting. Homes between $1 million and $1.5 million took 30 of the month’s 71 closings. They cleared in about 13 days and averaged 103.0% of original list price. No other band combined that much volume with that much speed.
| Price band | Sales | Volume | Avg. price | Avg. days on market | Avg. sale-to-list |
|---|---|---|---|---|---|
| Under $750K | 14 | $7,226,900 | $516,207 | 55 | 97.7% |
| $750K–$1M | 14 | $12,694,888 | $906,778 | 32 | 100.5% |
| $1M–$1.5M | 30 | $37,483,267 | $1,249,442 | 13 | 103.0% |
| $1.5M–$2M | 9 | $15,103,333 | $1,678,148 | 13 | 101.0% |
| $2M+ | 4 | $9,560,000 | $2,390,000 | 79 | 96.4% |
Fullerton home sales by price band, July 2026 closings. The $2M+ band carries four closings, so its averages describe those four homes rather than a price tier. Source: CRMLS via Pacific West Association of Realtors; analysis by Michael Mellgren, REALTOR®.
The spread between bands is the real finding. Under $750,000, Fullerton homes took 55 days and averaged 97.7% of original list. The $1 million to $1.5 million band took 13 days and finished above asking. That is a 42-day gap in speed and 5.3 points in pricing, inside one city and one month.
The top of the market stayed thin. Only four sales closed above $2 million in July 2026, averaging $2,390,000 at 96.4% of original list. Those four took 79 days on average, though a single listing sat 236 days and pulls that number up. Four sales describe those four homes, not a price tier.
How did Fullerton sellers do against their asking price?
Three of the five price bands closed above 100% of original list price in July 2026. The $1 million to $1.5 million band led at 103.0%. Next came $1.5 million to $2 million at 101.0%, then $750,000 to $1 million at 100.5%. Both ends lagged, at 97.7% under $750,000 and 96.4% above $2 million.
That pattern rewards accurate pricing over ambitious pricing. A home listed close to what its band is clearing tends to find its buyer quickly. Speed is what protects the final number. Homes that sit instead pile up days on market, and those days invite reductions.
What does the Fullerton housing market look like right now?
As of August 3, 2026, Fullerton held 147 active listings against 72 homes in escrow. That puts 32.9% of the market already under contract. Expected Market Time stood at 71 days, a Moderate Seller’s Market. The measure estimates how long current inventory would take to clear at the recent pace of escrows.
| Measure | Reading |
|---|---|
| Active listings | 147 |
| Homes in escrow | 72 ($75,898,547) |
| Share of market under contract | 32.9% |
| Expected Market Time | 71 days (Moderate Seller’s Market) |
| Average asking price (band-adjusted) | $1,155,955 |
| Average escrow clearing price (band-adjusted) | $1,097,454 |
| Actives holding within 1% of original list | 89 |
| Actives trimmed 1% to under 5% | 27 |
| Actives cut 5% or more | 31 |
Fullerton live market snapshot as of August 3, 2026. Source: CRMLS via Pacific West Association of Realtors; analysis by Michael Mellgren, REALTOR®.
Two live readings pull against each other, and both are worth knowing. On a band-adjusted basis, asking prices ran $58,500 above what escrows were clearing. That 5.1% premium means a share of sellers sit priced ahead of the market. Yet 89 of the 147 actives were still holding within 1% of their original number.
The price-cut posture is the reading to watch. Of the 58 Fullerton listings that have adjusted, 31 have cut 5% or more. That is 53% of all adjusted homes.
A trim under 5% usually just means a home found the market. Deeper cuts are the earlier signal, and the question is whether that share grows.
What July 2026 means for Fullerton buyers and sellers
The Fullerton housing market in July 2026 favored sellers, though the margin is narrower than the closed figures alone suggest. July closings averaged 100.9% of original list price, yet the live snapshot puts asking prices 5.1% above escrow clearing prices. Pricing to the second number rather than the first is what shortens a timeline.
Buyers have real room in specific places rather than across the board. Below $750,000, homes took 55 days and closed at 97.7% of original list. Citywide, 31 active listings have already cut 5% or more. In the $1 million to $1.5 million band, though, July moved fast enough that hesitation costs more than negotiation gains.
Both readings point to the same narrow conclusion. In Fullerton, the price band matters more than the citywide headline. So the useful question is never what the median did. It is what a specific address, in a specific band, would clear today.
Related reading covers the Fullerton housing market Q2 2026 results and the Fullerton housing market June 2026 results. The city’s standing against nine neighboring markets appears in the North Orange County housing market roundup.
Fullerton housing market FAQ (July 2026)
Is now a good time to sell a home in Fullerton?
July 2026 was a favorable month for Fullerton sellers. Homes closed at an average of 100.9% of original list price in about 29 days. As of August 3, 2026, the market held an Expected Market Time of 71 days, with 32.9% of listings under contract. That grades as a Moderate Seller’s Market.
Are Fullerton home prices rising or falling?
Fullerton’s median sale price was $1,125,000 in July 2026, up 5.9% from July 2025. That is a clean same-month comparison. Still, a single month reflects what happened to sell as much as what values did, so it reads as one data point rather than a trend line.
How long does it take to sell a home in Fullerton?
Fullerton homes that closed in July 2026 averaged 29 days on market. Speed varied sharply by price. The $1 million to $1.5 million band averaged 13 days, while homes under $750,000 averaged 55 days.
Is now a good time to buy a home in Fullerton?
Buyers in Fullerton had selective leverage in July 2026. Homes under $750,000 closed at 97.7% of original list price after an average of 55 days on market. As of August 3, 2026, 31 of the city’s 147 active listings had cut 5% or more from their original price.
How much inventory is on the Fullerton market right now?
Fullerton held 147 active listings as of August 3, 2026. Another 72 homes sat in escrow, representing $75,898,547 in committed volume. Those escrows will set the comparable sales appraisers rely on over the next 30 to 45 days.
Get a Fullerton address priced against these closings
A citywide median tells a Fullerton owner very little. One price band cleared in 13 days above asking, while another took 55 days below it. Michael Mellgren, REALTOR®, tracks every closed Fullerton sale as it records. He can show where a specific address sits inside these July 2026 results, band by band.
Measure a specific Fullerton address against these July closings before the listing goes live, not after two weeks of showings. Email Michael Mellgren about a Fullerton market question, or call or text (714) 420-6629. For loan terms and current rates, speak with a licensed lender.
Yorba Linda Housing Market: July 2026 Results
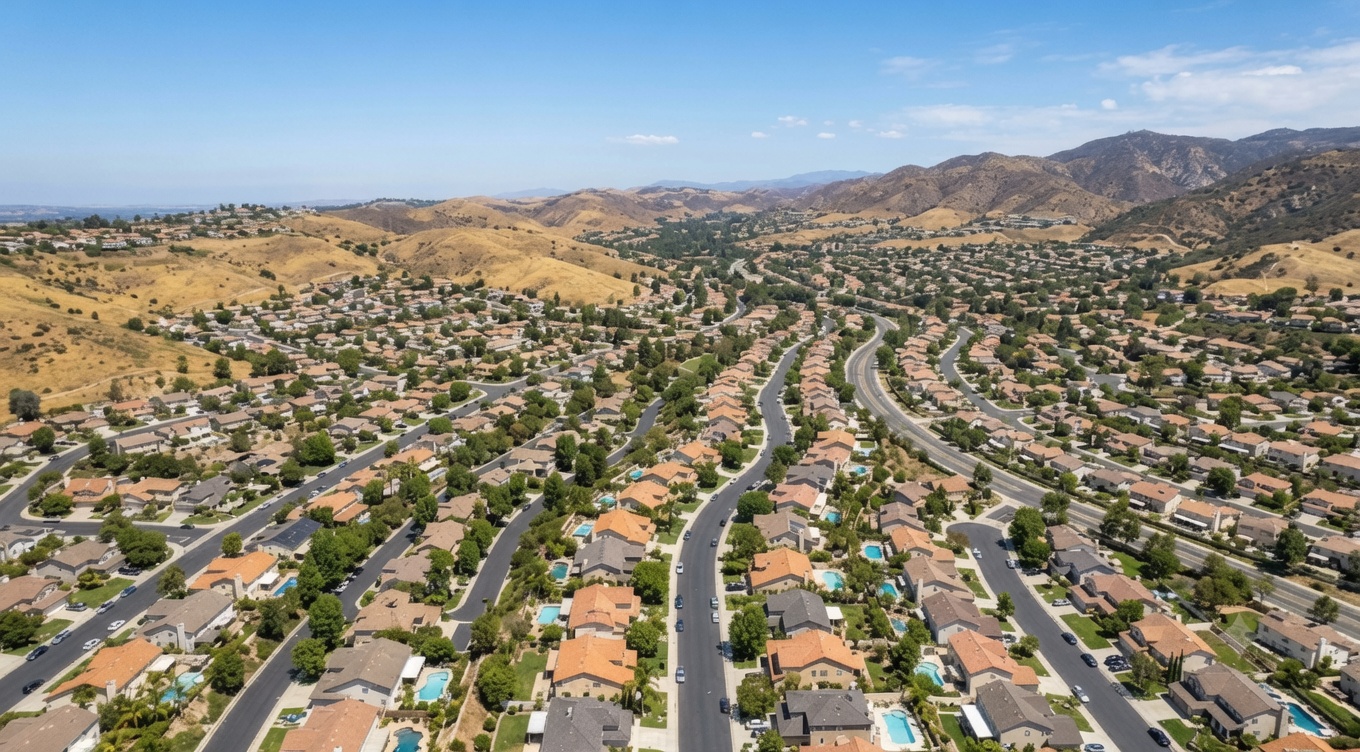
Quick Answer
The Yorba Linda housing market recorded 61 closed sales in July 2026, worth $86,213,150. The median sale price was $1,307,500, and sellers averaged 98.5% of original list price in about 29 days. Live inventory carries an Expected Market Time of 81 days, a moderate seller’s market.
Market data as of August 2, 2026. Closed figures cover July 2026 closings, based on CRMLS data via Pacific West Association of Realtors; analysis by Michael Mellgren, REALTOR® (DRE #02321556).
What happened in the Yorba Linda housing market in July 2026?
Yorba Linda closed 61 home sales in July 2026, totaling $86,213,150 in volume. The median price landed at $1,307,500, while the average came in higher at $1,413,330. That gap is routine here, because a small group of high-end sales pulls the average upward.
Sellers collected 98.5% of their original list price. That figure is the sale-to-list ratio, which compares the final sale price against the first price a home asked. Because it starts at the original ask, it absorbs every reduction taken along the way.
Speed held up alongside price. Homes averaged 29 days on market, the stretch from listing to signed contract. For the month directly before this one, see the results for the Yorba Linda housing market in June 2026.
Yorba Linda home sales by price band, July 2026
Activity concentrated in the middle of the market. The $1M to $1.5M band carried 27 of July’s 61 closings, or 44.3% of the month. Those homes cleared 99.4% of original list in about 19 days. Below it, the $750K to $1M band recorded only 5 sales, too thin a sample to read as a trend.
At the upper end, the $2M-plus tier posted 11 sales at 98.3% of original list. Those homes averaged 58 days on market, roughly three times the pace of the two bands directly beneath them.
| Price band | Sales | Volume | Avg. price | Avg. days on market | Avg. sale-to-list |
|---|---|---|---|---|---|
| Under $750K | 9 | $5,181,100 | $575,678 | 37 | 98.4% |
| $750K–$1M | 5 | $4,395,000 | $879,000 | 26 | 95.7% |
| $1M–$1.5M | 27 | $33,605,500 | $1,244,648 | 19 | 99.4% |
| $1.5M–$2M | 9 | $15,818,550 | $1,757,617 | 19 | 97.7% |
| $2M+ | 11 | $27,213,000 | $2,473,909 | 58 | 98.3% |
| All sales | 61 | $86,213,150 | $1,413,330 | 29 | 98.5% |
Yorba Linda home sales by price band, July 2026 closings. Source: CRMLS via Pacific West Association of Realtors; analysis by Michael Mellgren, REALTOR®.
Why the $2M-plus tier shaped July’s Yorba Linda numbers
Eleven sales set the tone for a month of 61. Yorba Linda’s $2M-plus tier produced 18.0% of July 2026 closings but 31.6% of the dollar volume, at an average price of $2,473,909. That concentration is why the month’s average price ran $105,830 above its median.
Time is where the tier separated further. Homes above $2 million averaged 58 days on market, against 19 days in both the $1M to $1.5M and $1.5M to $2M bands. Sellers at the top still priced firmly, clearing 98.3% of original list, yet they waited roughly three times as long to get there.
None of that says the upper end is weak. It says the upper end is slower, which matters most for planning a timeline rather than a price. A deeper read on where value sits by size, price range, and ZIP code appears in the analysis of what a Yorba Linda home is actually worth.
How close to asking did Yorba Linda homes sell in July 2026?
Sellers gave up little on price. The typical July 2026 sale in Yorba Linda closed at 98.5% of its original list price. That works out to about $1.50 conceded for every $100 first asked.
Band by band, though, the picture varied. The $1M to $1.5M band came closest to asking at 99.4%, while the $750K to $1M band trailed at 95.7% on only 5 closings. Read that lowest figure as a small sample rather than a signal.
Against July 2025, the month held flat on count and eased on price. Closings matched exactly at 61, volume fell 7.7%, and the median slipped 4.9%. Comparing one July with another is a clean like-for-like reading, yet it is still a single month rather than a trend.
What the live Yorba Linda market looks like as of August 2, 2026
The closed month and the live market answer different questions, so this post keeps the two apart. As of August 2, 2026, Yorba Linda held 152 active listings against 61 homes in escrow. That put 28.6% of the market under contract.
Expected Market Time stood at 81 days, which reads as a moderate seller’s market. The figure estimates how long today’s inventory would take to sell at the current pace of new escrows. It runs longer than average days on market because it counts every listing still waiting, not only the homes that already found a buyer.
Asking prices continue to sit above what escrows are clearing. Active listings averaged $1,809,100 against $1,764,445 in escrow, a gap of $44,655, or 2.5%. That comparison holds price band constant, so a shift in the mix of homes for sale cannot masquerade as a shift in price.
Price behavior across those 152 active listings split three ways. Ninety held within 1% of original list, 32 had trimmed 1% to just under 5%, and 30 had cut 5% or more.
| Measure | Data window | Figure |
|---|---|---|
| Closed sales | July 2026 closings | 61 |
| Total volume | July 2026 closings | $86,213,150 |
| Median sale price | July 2026 closings | $1,307,500 |
| Average sale-to-list | July 2026 closings | 98.5% |
| Average days on market | July 2026 closings | 29 |
| Active listings | Live, August 2, 2026 | 152 |
| Homes in escrow | Live, August 2, 2026 | 61 |
| Share of market under contract | Live, August 2, 2026 | 28.6% |
| Expected Market Time | Live, August 2, 2026 | 81 days (moderate seller’s market) |
| Asking-to-escrow gap | Live, August 2, 2026 | $44,655 (2.5%) |
Yorba Linda closed July 2026 results beside the live market as of August 2, 2026. Source: CRMLS via Pacific West Association of Realtors; analysis by Michael Mellgren, REALTOR®.
What July 2026 means for Yorba Linda buyers and sellers
Sellers kept the stronger hand. Homes cleared 98.5% of original list in about 29 days during July 2026, and 28.6% of the market sat under contract on August 2, 2026. Consequently, a listing priced against recent closings still meets committed demand.
Pricing at the top of the range carries a time cost, though. The $2M-plus tier averaged 58 days on market, so a seller in that band should plan a longer runway from sign to signature. Timing gets a fuller treatment in the read on the best time to sell a Yorba Linda home.
Buyers, meanwhile, have room on the listings that reached too high. Thirty active listings had already cut 5% or more as of August 2, 2026. Asking prices also ran 2.5% above escrow prices, even after adjusting for price band. Homes priced to the closed comparable sales, by contrast, kept moving in under a month.
Yorba Linda housing market FAQ: July 2026
Is now a good time to sell in Yorba Linda?
Conditions favored sellers in Yorba Linda through July 2026. Across 61 closed sales, homes cleared 98.5% of original list price in about 29 days. As of August 2, 2026, Expected Market Time stood at 81 days, a moderate seller’s market, with 28.6% of the market under contract.
Are home prices rising or falling in Yorba Linda?
Yorba Linda’s median sale price was $1,307,500 in July 2026, about 4.9% below July 2025. Treat that as a single-month reading rather than a trend, because a median moves mainly with the mix of homes that happen to close. Closings matched the prior July exactly, at 61.
How long does it take to sell a home in Yorba Linda?
Homes in Yorba Linda averaged 29 days on market across 61 closings in July 2026. Speed varied sharply by price, running 19 days in the $1M to $1.5M band against 58 days above $2 million. The live Expected Market Time was 81 days as of August 2, 2026.
How many homes are for sale in Yorba Linda right now?
Yorba Linda held 152 active listings as of August 2, 2026, with another 61 homes in escrow. That puts 28.6% of the market under contract. Of those 152 active listings, 90 were still holding within 1% of their original asking price.
Is now a good time to buy in Yorba Linda?
Buyers in Yorba Linda had negotiating room on overpriced listings in July 2026. Of 152 active listings on August 2, 2026, 30 had already cut their price by 5% or more. Asking prices also ran $44,655 (2.5%) above what escrows were clearing, adjusted for price band.
Price a Yorba Linda address against July’s closings
A month of citywide averages sets the frame. The number that decides a sale or an offer, however, depends on the street, the price band, and the condition of the home.
Michael Mellgren, REALTOR®, tracks every Yorba Linda closing as it records. He can set a specific address beside July’s comparable sales, its price band’s average days on market, and the current gap between asking and escrow.
Measure a specific address against July’s 61 closings before setting a list price or writing an offer, not after a reduction is already on the table. Email Michael Mellgren about the Yorba Linda market, or call or text (714) 420-6629. For tax or legal specifics, consult a qualified professional.
Yorba Linda Home Values in 2026: What Your Home Is Actually Worth
Quick Answer
Yorba Linda home values centered on a median sale price of $1,300,000 across 387 closings between January 1 and July 31, 2026, worth $558,226,528 in total volume. Sellers averaged 98.6% of original list price in about 35 days. Individual sale prices ran from $340,000 to $6,000,000, so very few homes are worth anything close to the median.
Market data as of July 31, 2026. Closed figures cover January 1 through July 31, 2026, based on CRMLS data via Pacific West Association of Realtors; analysis by Michael Mellgren, REALTOR® (DRE #02321556).
What is my home worth in Yorba Linda?
No citywide figure prices an individual Yorba Linda home. The 2026 median of $1,300,000 sat in the middle of 387 closings, yet the middle half of those sales spread from $960,000 to $1,750,000. Roughly a quarter closed below $960,000, and another quarter closed above $1,750,000.
Size explains much of that spread. The median home that sold measured 1,958 square feet. The smallest tenth came in under 1,108 square feet, and the largest tenth ran above 3,838. Because value tracks size, price range, and location together, a useful estimate starts with comparable closings rather than a single city average.
Condition, view, lot usability, and recent work also move the number. None of those appear in an estimate generated from public records, though all of them show up in a closing. Price direction across the year is a separate question, covered in the analysis of whether Yorba Linda home prices are falling in 2026.
Yorba Linda home values by price range
The $1M–$1.5M range carried the largest share of Yorba Linda home values recorded in 2026, with 142 of 387 closings, or 36.7% of the market. That range also cleared closest to asking, at 99.9% of original list price, and averaged 24.2 days on market.
Sale-to-list compares the final sale price with the price a home was first listed at. A reading of 99.9% means the typical sale in that range closed just under its original asking price. Both ends of the market cleared further below asking, at 97.6% under $750,000 and 97.7% above $2,000,000.
| Price band | Sales | Median sale price | Median price per square foot | Avg. days on market | Avg. sale-to-list |
|---|---|---|---|---|---|
| Under $750K | 63 | $600,000 | $542 | 38.0 | 97.6% |
| $750K–$1M | 41 | $865,000 | $608 | 30.7 | 99.4% |
| $1M–$1.5M | 142 | $1,244,966 | $673 | 24.2 | 99.9% |
| $1.5M–$2M | 74 | $1,691,500 | $615 | 38.7 | 97.5% |
| $2M+ | 67 | $2,440,000 | $689 | 51.4 | 97.7% |
| All bands | 387 | $1,300,000 | $624 | 34.6 | 98.6% |
Yorba Linda home values by price band, January 1 through July 31, 2026 closings. Sale-to-list is computed on the 384 of 387 closings carrying a valid original list price. Source: CRMLS via Pacific West Association of Realtors; analysis by Michael Mellgren, REALTOR®.
Days on market climbed with price. Homes below $2,000,000 averaged between 24.2 and 38.7 days, while the $2M+ tier averaged 51.4. A fuller quarter-by-quarter picture sits in the review of the Yorba Linda housing market in Q2 2026.
How much is a Yorba Linda home worth per square foot?
The median Yorba Linda home sold for $624 per square foot between January 1 and July 31, 2026. That single figure hides a wide band, because the middle 80% of 2026 closings ran from $487 to $810 per square foot. Applying one citywide rate to a specific address will therefore overprice some homes and underprice others.
Price per square foot also does not climb evenly with price. Homes in the $1M–$1.5M range cleared at a median of $673 per square foot. That sits above the $615 recorded in the $1.5M–$2M range directly above it.
Larger homes cost more in total while earning less for each foot. The $1.5M–$2M range carried a median of 2,807 square feet against 1,802 in the range below.
Only the $2M+ tier ran higher, at $689 per square foot. Consequently, a per-foot rate borrowed from a neighboring price range can miss a specific home by a wide margin.
Do Yorba Linda home values differ between 92886 and 92887?
Yes. The city’s two ZIP codes recorded measurably different Yorba Linda home values in 2026. Across 254 sales, homes in 92886 closed at a median of $1,325,000 and $640 per square foot. Across 133 sales, 92887 closed at a median of $1,210,000 and $583 per square foot.
Speed differed as well. Sales in 92886 averaged 31.9 days on market against 39.8 in 92887, while sale-to-list came in at 98.8% and 98.3% respectively. Both figures describe averages across an entire ZIP code, so neither replaces a read on a specific street.
| ZIP code | Sales | Median sale price | Median price per square foot | Avg. days on market | Avg. sale-to-list |
|---|---|---|---|---|---|
| 92886 | 254 | $1,325,000 | $640 | 31.9 | 98.8% |
| 92887 | 133 | $1,210,000 | $583 | 39.8 | 98.3% |
Yorba Linda closings by ZIP code, January 1 through July 31, 2026. Source: CRMLS via Pacific West Association of Realtors; analysis by Michael Mellgren, REALTOR®.
What Yorba Linda sellers are asking versus what buyers are paying
Asking prices in Yorba Linda ran $56,780 above what escrows were clearing as of July 31, 2026. That comparison is adjusted so it holds price band constant, which keeps a shift in the mix of homes for sale from masquerading as a shift in price. That gap is the practical reason a list price is not a value. The market sets the second number, while the first is only a proposal.
The live market held 153 active listings, an Expected Market Time of 67 days, and 28.2% of the market under contract. Expected Market Time estimates how long the current inventory would take to sell at today’s pace of new escrows. At 67 days, Yorba Linda reads as a moderate seller’s market. The timing case sits in the review of the best time to sell a Yorba Linda home.
Price posture among those active listings split three ways as of July 31, 2026. Ninety-one listings still held within 1% of original list. Another 33 had trimmed 1% to just under 5%.
A further 29 had cut 5% or more, which is 47% of all adjusted homes. More context sits in the analysis of buying a Yorba Linda home without a bidding war.
Frequently asked questions
How much is a Yorba Linda home worth per square foot?
The median Yorba Linda sale between January 1 and July 31, 2026 cleared at $624 per square foot. However, the middle 80% of those 387 closings ran from $487 to $810 per square foot. The citywide figure is a starting point, not an answer for a specific address.
Is an online home value estimate accurate in Yorba Linda?
An automated estimate is built from public records and past sales. It cannot account for condition, view, lot usability, or recent work. In a city where 2026 closings ran from $340,000 to $6,000,000, that gap matters. Comparing a specific home against recent closings in its own price range and ZIP code produces a closer number.
Do homes in Yorba Linda sell for their asking price?
On average they closed slightly below it. Across 387 closings between January 1 and July 31, 2026, the typical Yorba Linda sale cleared at 98.6% of its original list price. The $1M–$1.5M range came closest, at 99.9%.
What is Expected Market Time?
Expected Market Time estimates how many days the current inventory would take to sell, at today’s pace of new escrows. Yorba Linda held 67 days as of July 31, 2026. It runs longer than average days on market. The reason is that it measures the whole standing inventory, not only the homes that already sold.
Put a Real Number on a Specific Yorba Linda Address
A citywide median cannot price one address, and neither can an estimate generated from public records. Michael Mellgren, REALTOR®, tracks every Yorba Linda closing as it records. He can set a specific home against the sales in its own price range, size, and ZIP code.
Have that number checked against real closings before a listing price is set, not after the first two weeks of showings. Email Michael Mellgren about a Yorba Linda home value, or call or text (714) 420-6629.
Which North Orange County Markets Are Holding Up Best as Mortgage Rates Rise?
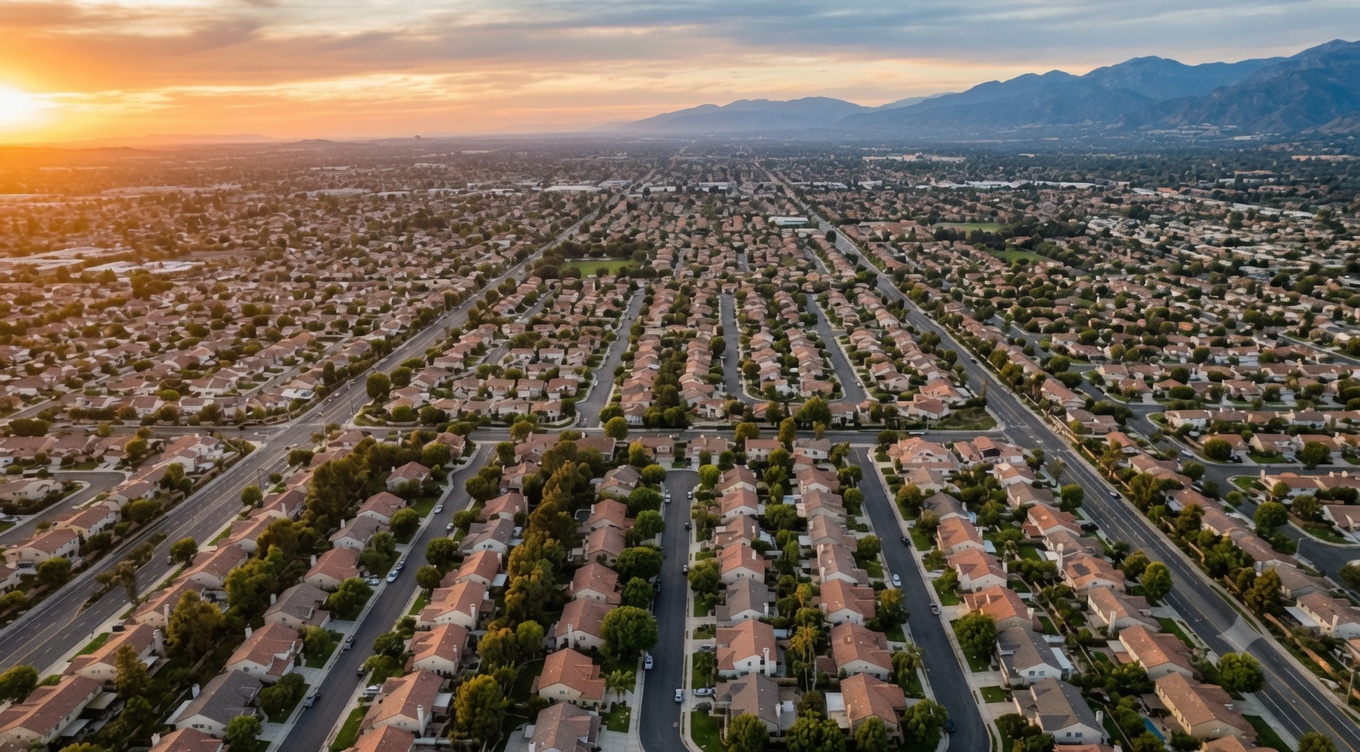
Quick Answer
Brea is holding up best. The North Orange County housing market recorded 2,825 closed sales across ten markets from January 1 through July 30, 2026. Sellers averaged 99.6% of original list price in 30.6 days. Brea led at 101.8% in 23.1 days, and Villa Park trailed at 95.9%.
Market data as of July 30, 2026. Rate figures come from the Freddie Mac Primary Mortgage Market Survey, week ending July 30, 2026. Closing figures are based on CRMLS data via Pacific West Association of Realtors (as of July 30, 2026); analysis by Michael Mellgren, REALTOR® (DRE #02321556).
How is the North Orange County housing market holding up as mortgage rates rise?
It has not repriced. Ten North Orange County markets recorded 2,825 closed sales between January 1 and July 30, 2026. Volume reached $3.26 billion. Sellers averaged 99.6% of original list price.
Sale-to-list is the final sale price divided by the first asking price. At 99.6%, the typical seller across the region gave up under half a percentage point from day-one asking. Prices are the slowest part of a market to move, and so far they have not moved.
The ten markets are Anaheim, Anaheim Hills, Brea, Buena Park, Fullerton, La Habra, Orange, Placentia, Villa Park, and Yorba Linda. Anaheim Hills is tracked separately from Anaheim, so no sale is counted twice.
Rates, meanwhile, have climbed four weeks running. That gap between a rising rate and a flat closed record is the whole story. It also does not sit evenly across the region.
How high are mortgage rates right now?
The 30-year fixed-rate mortgage averaged 6.66% for the week ending July 30, 2026. That figure comes from the Freddie Mac Primary Mortgage Market Survey. It is the highest weekly reading of 2026.
It is also the fourth straight weekly increase. The prior readings were 6.43% on July 2, 6.49% on July 9, 6.55% on July 16, and 6.58% on July 23.
Measured from the 2026 low of 5.98% in late February, the 30-year fixed has added 0.68 percentage points. The latest step, 0.08 points in one week, was the largest of the run.
One caution belongs here. The survey publishes a national average for conventional, conforming purchase loans with 20% down and strong credit. It is a benchmark, not a quote, and only a licensed lender can price a specific loan.
Which North Orange County markets are holding up best?
Brea leads the region on both measures that matter to a seller. Across 158 closed sales this year, Brea cleared 101.8% of original list price in 23.1 days. No other market in the ten averaged above asking.
Anaheim and Fullerton follow at 100.0%, and Placentia at 99.9%. At the other end, Yorba Linda averaged 98.6% and Anaheim Hills 98.5%, both still within a point and a half of asking.
| Market | Sales | Median price | Avg. sale-to-list | Avg. days on market |
|---|---|---|---|---|
| Brea | 158 | $1,167,500 | 101.8% | 23.1 |
| Anaheim | 616 | $918,500 | 100.0% | 29.2 |
| Fullerton | 436 | $1,052,500 | 100.0% | 31.4 |
| Placentia | 184 | $1,163,000 | 99.9% | 24.1 |
| Buena Park | 209 | $910,000 | 99.5% | 27.9 |
| La Habra | 182 | $838,750 | 99.2% | 32.8 |
| Orange | 477 | $1,208,000 | 99.2% | 30.7 |
| Yorba Linda | 382 | $1,300,000 | 98.6% | 34.8 |
| Anaheim Hills | 152 | $1,200,000 | 98.5% | 33.2 |
| Villa Park | 29 | $2,869,888 | 95.9% | 67.2 |
| All ten markets | 2,825 | $1,033,000 | 99.6% | 30.6 |
North Orange County closed sales by market, January 1–July 30, 2026, ranked by average sale-to-list. Source: CRMLS via Pacific West Association of Realtors; analysis by Michael Mellgren, REALTOR®.
Villa Park sits apart and needs a caveat rather than a headline. Its 29 closed sales are far too few to read as a trend. Its median of $2,869,888 also puts it in a different price world.
Scale matters when ranking markets. Anaheim alone contributed 616 closings and Orange 477, so those averages rest on real volume. A market with 29 sales can swing on a single unusual transaction.
Which markets slowed the most since May?
Orange slowed most on price. Its sale-to-list fell 2.6 points between May and July 2026, from 100.5% to 97.9%. Average days on market rose from 20.8 to 32.5.
Anaheim followed a similar path, easing 1.2 points to 99.7% while days on market climbed from 19.7 to 32.0. Both markets were running unusually hot in May, so part of this is a return toward their own yearly averages.
| Market | Avg. sale-to-list (May) | Avg. sale-to-list (July) | Avg. days on market (May) | Avg. days on market (July) |
|---|---|---|---|---|
| Anaheim Hills | 99.9% | 100.5% | 25.1 | 23.5 |
| Brea | 101.6% | 101.7% | 24.3 | 24.5 |
| Fullerton | 100.9% | 100.9% | 27.3 | 29.5 |
| La Habra | 99.0% | 98.5% | 33.2 | 35.4 |
| Yorba Linda | 99.1% | 98.1% | 27.8 | 29.9 |
| Anaheim | 100.9% | 99.7% | 19.7 | 32.0 |
| Buena Park | 99.8% | 98.3% | 22.3 | 23.9 |
| Placentia | 100.6% | 98.7% | 19.0 | 25.1 |
| Villa Park | 99.1% | 97.2% | 35.6 | 23.8 |
| Orange | 100.5% | 97.9% | 20.8 | 32.5 |
North Orange County closed sales, May 2026 compared with July 2026, ordered by change in average sale-to-list. Source: CRMLS via Pacific West Association of Realtors; analysis by Michael Mellgren, REALTOR®.
Three markets barely moved. Brea held at 101.7%, with days on market flat at 24.5, and Fullerton held at 100.9%. Anaheim Hills actually improved, rising to 100.5% while selling faster.
One honest limit applies to every number above. A home closing in July generally went under contract in late May or June. July’s figures therefore cannot yet reflect the rate moves of July 16, 23, and 30.
The closed record is a rear-view mirror. What it shows is which markets entered this stretch with the most cushion, not which ones have already absorbed a higher rate.
What does a higher rate do to buying power?
A higher rate shrinks what a buyer can borrow at the same monthly payment. Take the ten-market median sale price of $1,033,000 with 20% down, which is an $826,400 loan.
At 5.98%, monthly principal and interest runs about $4,944. At 6.66%, the same loan costs about $5,311. The difference is roughly $367 a month.
Flip that around and the effect on demand gets clearer. Hold the payment steady at $4,944, and a borrower at 6.66% supports about $769,400 instead of $826,400, which is 6.9% less purchasing power.
Even the four-week move from 6.43% to 6.66% costs roughly $19,500 of borrowing capacity. These figures are illustrations on the regional median, and they exclude taxes and insurance.
Have home prices actually fallen in North Orange County?
No. The regional median reached $1,033,000 year to date against $1,000,000 in the same window of 2025, up 3.3%. Sale-to-list slipped one tenth of a point, from 99.7% to 99.6%.
Volume tells a similar story. Closings ran 2,825 against 2,848 last year, down 0.8%, and dollar volume ran $3.26 billion against $3.28 billion, down 0.6%. Both are essentially flat.
Speed is where the year gave ground. Average days on market ran 30.6 against 27.8 in the same period of 2025, so homes took about three days longer.
Rates also sit slightly below where they were a year ago. The 30-year fixed averaged 6.72% in the same week of 2025, so the current 6.66% is 0.06 points lower, a gap that has nearly closed.
What the live market looks like right now
As of July 30, 2026, the ten markets held 1,006 active listings with a further 443 homes under contract. That puts 30.6% of the combined market in escrow.
Expected Market Time measures how long it would take to sell every active listing. The pace of new escrows sets it. It splits the region sharply:
- Brea, 49 days, a deep seller’s market
- Orange, 55 days, a deep seller’s market
- Buena Park, 56 days, a deep seller’s market
- Anaheim Hills, 57 days, a deep seller’s market
- Fullerton, 67 days, a moderate seller’s market
- Yorba Linda, 68 days, a moderate seller’s market
- Placentia, 69 days, a moderate seller’s market
- La Habra, 78 days, a moderate seller’s market
- Anaheim, 88 days, a moderate seller’s market
- Villa Park, 165 days, a buyer’s market
Villa Park is the only market of the ten reading as a buyer’s market, which fits its thin volume and high price point. Every other market still favors sellers.
Seller pricing posture points the same way. Of the 1,006 active listings, 647 were still within 1% of original asking. Another 228 had trimmed 1% to just under 5%, and 131 had cut 5% or more.
That last group is 13.0% of active inventory. It is a figure worth watching, not a leverage shift already underway.
City-level timing is covered separately for three of these markets. See the best time to sell a Brea home, the best time to sell a home in Orange, and the best time to sell a Yorba Linda home. Sellers who have settled the timing can walk the full process. The guide to how to sell your home in Orange County covers it.
Frequently asked questions about the North Orange County housing market
Is now a good time to sell in North Orange County?
The closed record supports listing. Sellers across the ten markets averaged 99.6% of original list price in 30.6 days, across 2,825 sales through July 30, 2026. Nine of the ten markets still read as seller’s markets.
That said, the answer is market-specific. Brea at 23.1 days and Villa Park at 67.2 days are not the same decision. The North Orange County housing market is ten markets, not one.
Do rising mortgage rates lower home prices right away?
No, and the 2026 record shows the lag clearly. The 30-year fixed rose 0.68 percentage points from its February low to 6.66% on July 30, 2026. Yet regional monthly sale-to-list never fell below 98.4% in any month of 2026.
Rate pressure surfaces first in showing traffic and days on market. It reaches sale prices last, and often months later.
Which North Orange County city sells fastest?
Brea, at an average of 23.1 days on market across 158 closed sales from January 1 through July 30, 2026. Placentia follows at 24.1 days and Buena Park at 27.9 days.
Villa Park is slowest at 67.2 days. Its 29 sales make that a small-sample reading rather than a firm trend.
How much has the 30-year fixed rate moved in 2026?
The 30-year fixed opened 2026 at 6.16% for the week ending January 8. It bottomed at 5.98% on February 26 and reached 6.66% on July 30, its high for the year.
Freddie Mac publishes the survey every Thursday at noon Eastern. The figure therefore changes weekly.
Find out where a specific address sits in this market
A regional average does not price a house. Brea and Villa Park sit at opposite ends of this same market, and the gap between them is wider than anything rates have done this year.
Michael Mellgren, REALTOR®, tracks every closed sale across all ten North Orange County markets. He can show how comparable homes in a given city and price band have actually cleared this year. Check where a particular address sits against its own market’s numbers before setting a list price, not after the first price reduction.
For a read on a specific property, email Michael Mellgren about the North Orange County market, or call or text (714) 420-6629. Rate quotes on an actual loan come from a licensed mortgage lender. For tax questions on a sale, consult a qualified tax professional.
Selling a Home With Unpermitted Work in California: Disclosure, Risk, and Your Options
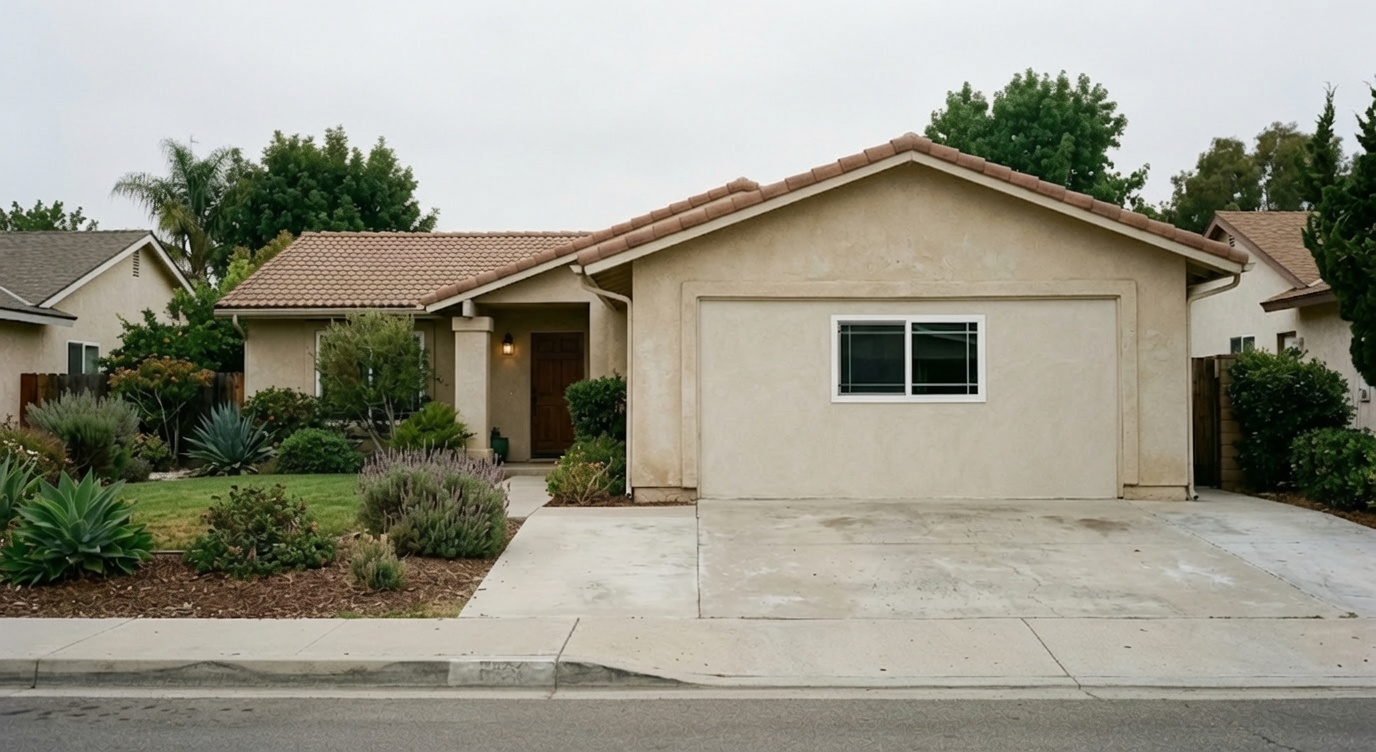
Quick Answer
Selling a home with unpermitted work in California is legal, and it happens in every price band. Disclosure is not optional. The state transfer disclosure form asks, in plain words, about room additions, structural changes, or other work done without necessary permits. A seller who knows the answer must give it.
Disclosure, permitting, lending, and assessment rules verified as of July 28, 2026. Analysis by Michael Mellgren, REALTOR® (DRE #02321556).
Do you have to disclose unpermitted work when selling a house in California?
Yes, and the form names unpermitted work directly. Civil Code section 1102.6 sets out the Real Estate Transfer Disclosure Statement, the main disclosure form in a California home sale.
Section C asks two separate questions. One covers work done without necessary permits. The other covers work that breaks building codes.
The duty tracks what the seller actually knows. So a seller who added a bedroom over a patio slab in 2009 without a permit answers yes. Age, quality, and a prior sale change nothing.
Skipping the disclosure carries a price. Under Civil Code section 1102.13, a seller who willfully or negligently skips a disclosure duty owes the buyer actual damages. That exposure sits with the seller, and it outlives the closing.
Does an “as is” sale remove the duty?
No. Civil Code section 1102.1(a) speaks to this point. A seller cannot waive the transfer disclosure form in an as-is sale, per Loughrin v. Superior Court (1993) 15 Cal.App.4th 1188.
That section also leaves an agent’s duty under Civil Code section 2079 in place. Both duties run at once.
Think of it this way. An as-is clause tells the buyer not to expect repairs. It does not tell the seller to stop talking.
What if the seller does not know whether anyone pulled a permit?
Say so, then go find out. Permit history is a public record. The city or county that issued the permit holds the file. Most building departments will pull it on request.
The form asks what the seller is aware of. An honest “unknown” is therefore a legitimate answer. A confident “permitted” that later proves wrong is not.
What happens if the work turns up mid-escrow?
A late disclosure restarts a clock for the buyer. Under Civil Code section 1102.3, where a required disclosure or a material amendment to one arrives after the buyer executed the offer, the buyer may terminate by written notice within three days of personal delivery, or five days of delivery by mail or electronic record.
So amending the form on day 20 of a 30-day escrow hands the buyer a fresh exit. So sort out permit history before the listing goes live. The same fact then shapes an offer up front, rather than unwinding one later.
Does unpermitted work become legal after four years?
No. Nothing in California law turns unpermitted construction into permitted construction over time. The four-year and ten-year figures that circulate online come from two statutes that do something else.
Code of Civil Procedure section 337.1 blocks a claim against a designer or builder four years after the work is done. It covers a patent flaw, one you could spot on a reasonable inspection. Section 337.15 sets a ten-year outside limit for a latent flaw, one you could not. By its own terms, section 337.15 does not reach fraud or willful misconduct.
Both statutes aim at the people who designed and built the work. Neither one limits the building department. That distinction is the whole ballgame, and most online summaries skip it.
One further detail rarely surfaces. Section 337.1(d) bars that four-year defense for anyone in actual possession or control of the work, as owner or tenant, when the flaw causes the harm. So the current owner gets no shield. The original builder does.
A related mix-up is worth clearing up. A permitted structure that no longer meets a later code is legal nonconforming, and it keeps that status. Unpermitted work never entered that status, so time has nothing to preserve.
What each authority actually controls
| The question | What controls the answer | Authority |
|---|---|---|
| Must the seller disclose it? | Yes, in writing, on the transfer disclosure statement | Civil Code section 1102.6 |
| Does an as-is sale remove the duty? | No; a seller cannot waive the disclosure statement in an as-is sale | Civil Code section 1102.1(a) |
| What is owed if the seller skips it? | Actual damages, for a willful or negligent violation | Civil Code section 1102.13 |
| Does age make the work legal? | No; those clocks limit suits against the builder, not city enforcement | Code of Civil Procedure sections 337.1 and 337.15 |
| When is a condition substandard? | When a listed condition endangers occupants, nearby residents, or the public | Health and Safety Code section 17920.3 |
| Can a city refuse to legalize an older ADU? | Not for code or ordinance noncompliance alone, if built before January 1, 2020 | Government Code section 66311.7, formerly section 66332 |
| Will a conventional lender still finance it? | Usually, once the appraiser comments on the work and its effect on value | Fannie Mae Selling Guide B4-1.3-05 |
| Does skipping the permit avoid reassessment? | No; the assessor values the new portion either way | Revenue and Taxation Code sections 71 and 72 |
How California law treats unpermitted work on a home sale, verified July 2026. Source: California Civil Code, Code of Civil Procedure, Health and Safety Code, Government Code, Revenue and Taxation Code, and the Fannie Mae Selling Guide section on additions without permits; analysis by Michael Mellgren, REALTOR®.
What are the options for selling a home with unpermitted work?
Five paths cover almost every situation. The right one turns on the size of the work, its quality, and the seller’s timeline. Each path is lawful. So this is a business call, not a legal bind.
- Permit it before listing. The city reviews the work and inspects it. That often means opening walls so an inspector can see wiring, framing, and plumbing.
- Disclose it and sell as is. This fits sound work and a buyer pool that accepts it, with the price set to match.
- Legalize it under the ADU rules, if the space is an ADU or junior ADU built before January 1, 2020.
- Remove it and restore the original condition. That is often the answer for a small, poorly built addition.
- Negotiate a credit or an escrow holdback so the buyer finishes the permitting after closing, on terms both sides sign.
One honest counterweight belongs here. A retroactive permit application invites the city to look at the whole property. A city can also make the work meet today’s code, not the code in force the year it went up.
So a seller weighing option one should move slowly. Get a licensed contractor to scope the risk first. Then ask the city how it handles legalization, before filing anything.
The amnesty for unpermitted ADUs built before January 1, 2020
California bars a city from denying a permit to legalize an unpermitted accessory dwelling unit, or ADU, built before January 1, 2020. That bar applies where the only grounds are a building standards violation or a clash with the local ADU rules. Junior ADUs get the same shield. Assembly Bill 2533 (Chapter 834, Statutes of 2024) moved the cutoff from 2018 to 2020, as of January 1, 2025.
The section number changed lately, which trips up much of the coverage online. The rule used to sit at Government Code section 66332. Senate Bill 543 (Chapter 520, Statutes of 2025) moved it to section 66311.7. The state Department of Housing and Community Development logged that change in its March 2026 ADU handbook.
The protection is broad, but it has limits. A city may still deny the permit if it finds a fix is needed to protect the health and safety of the public or the occupants. The shield also stops at a building deemed substandard under Health and Safety Code section 17920.3.
That statute sets the bar. A building is substandard when a listed condition endangers occupants, neighbors, or the public. Bad sanitation, faulty wiring, and structural hazard all sit on the list.
Three features matter most to a seller. First, an owner legalizing a pre-2020 unit owes no impact fees and no connection or capacity charges. The one exception is utility work needed to satisfy section 17920.3.
Second, a city inspector may look at the unit and advise on health and safety standards. Third, the city may not penalize the owner for having the unit. It must also issue the permits needed to fix what it finds.
Note the limit, because it is easy to overread. This amnesty covers ADUs and junior ADUs only. An unpermitted bathroom, a patio cover, or a bedroom addition gets nothing from it. Nor does a converted garage that is not a separate dwelling.
Going forward, local rules still govern what a new unit may look like. In this area that means codes such as the Orange ADU rules.
How lenders and appraisers handle unpermitted additions
An unpermitted addition rarely kills a conventional loan on its own. Under the Fannie Mae Selling Guide section on additions without permits, an appraiser who spots an addition without the required permit must comment on the quality and appearance of the work. The appraiser must also state its impact, if any, on market value. Nothing rules the home out, and no rule says the space is worth zero.
The stricter case is an ADU that zoning does not allow at all. Fannie Mae accepts that property under five conditions:
- The lender confirms the unit will not threaten a future property insurance claim.
- Its use fits the neighborhood and the market.
- An appraiser values the home on its current use.
- The report states that the work does not comply with zoning.
- That same report shows the work is typical for the market, using at least two comparable sales with the same zoning problem, within at least three settled sales.
Sellers most often miss that first condition. A carrier can argue that it never priced the added space. So get the policy’s treatment of it in writing. Do not assume coverage follows the square footage.
The 18-month rule for a recently purchased home
A seller who accepts an offer within 18 months of taking title carries an extra disclosure duty. Civil Code section 1102.6h, added by Assembly Bill 968 (Chapter 95, Statutes of 2023), covers single-family sales. It applies where the seller accepts an offer on or after July 1, 2024, and it aims at quick resales.
The seller must disclose any room additions, structural changes, or other work done since taking title, where a hired contractor did it. The seller must also name each such contractor and give contact details. That naming duty starts once the total contract price for labor, material, and all other items passes the threshold in Business and Professions Code section 7027.2. Assembly Bill 2622 (Chapter 240, Statutes of 2024) set it at $1,000, as of January 1, 2025.
Permits ride along with the duty. A seller who got a permit for the disclosed work must give the buyer a copy. Where a third party pulled the permit and never handed one over, the seller may instead point the buyer to that third party and supply the contact details.
Who performed the work matters
The owner-builder exemption is narrower than most owners assume. Section 7044 of the same code lets an owner improve their own property without a contractor license. That exemption holds only if the work is not intended or offered for sale. A pending listing collides with the clause.
Section 7044(b)(1) sets the trap. If an owner-builder sells or offers a structure within one year after it is done, the law presumes the work was for sale. That presumption is rebuttable, though at five or more structures in one year, section 7044(b)(2) makes it conclusive.
So a permit finaled under an owner-builder declaration weeks before listing is worth raising with counsel. It is a fact a buyer’s agent may well notice.
Frequently asked questions
Can you legally sell a house with unpermitted work in California?
Yes. No California statute forbids the sale, and buyers purchase homes with unpermitted improvements every week. What the law demands is written disclosure under Civil Code sections 1102 through 1102.17, given before title transfers. A seller cannot waive that form in an as-is sale.
Should unpermitted square footage be advertised as living area?
Treat it as described space, not as advertised living area. Fannie Mae tells the appraiser to comment on an addition that lacks the required permit, and it puts ADU area on its own line rather than folded into the main home’s finished square footage. So describe the space and state its permit status. That version holds up in an appraisal and in a disclosure review.
Does a retroactive permit increase the property tax bill?
The tax does not turn on the permit. Under Revenue and Taxation Code section 71, the assessor sets a new base year value for the new portion only, and section 72 makes cities and counties send building permits to the assessor. For the fuller picture on which projects are taxed, see does remodeling raise your property taxes in California, then consult a qualified tax professional about a specific address.
What happens if a buyer discovers unpermitted work after closing?
The exposure runs to the seller. Under Civil Code section 1102.13, a seller who willfully or negligently skips a disclosure duty owes the buyer actual damages. Code of Civil Procedure section 337.15 also keeps fraud and willful misconduct outside its ten-year limit. Anyone in that spot, on either side, should consult a qualified real estate attorney.
Is it better to permit the work or to price for it?
There is no single right answer. Selling a home with unpermitted work can go either way, and the size of the work and the timeline drive the call. Permitting first closes the question and can widen the buyer pool.
Pricing for it instead avoids a slow inspection process on a tight deadline. Run the numbers both ways before listing, alongside how to sell your home in Orange County.
Sorting out a permit history before the home goes on the market
Unpermitted work changes how a home is disclosed, priced, appraised, and insured. Sorting it out before a listing goes live beats finding it in escrow.
Michael Mellgren, REALTOR®, follows California disclosure and land-use rules closely. He can help map a home’s permit history, weigh the legalize-versus-disclose call, and build the disclosure package for any address on the list. Email Michael Mellgren about selling a home with unpermitted work, or call or text (714) 420-6629.
Some of this needs a specialist. For permitting scope and cost, consult a licensed contractor and the local building department. On disclosure and liability in a specific deal, consult a qualified real estate attorney. On assessment effects, consult a qualified tax professional.
Does Remodeling Raise Your Property Taxes in California?
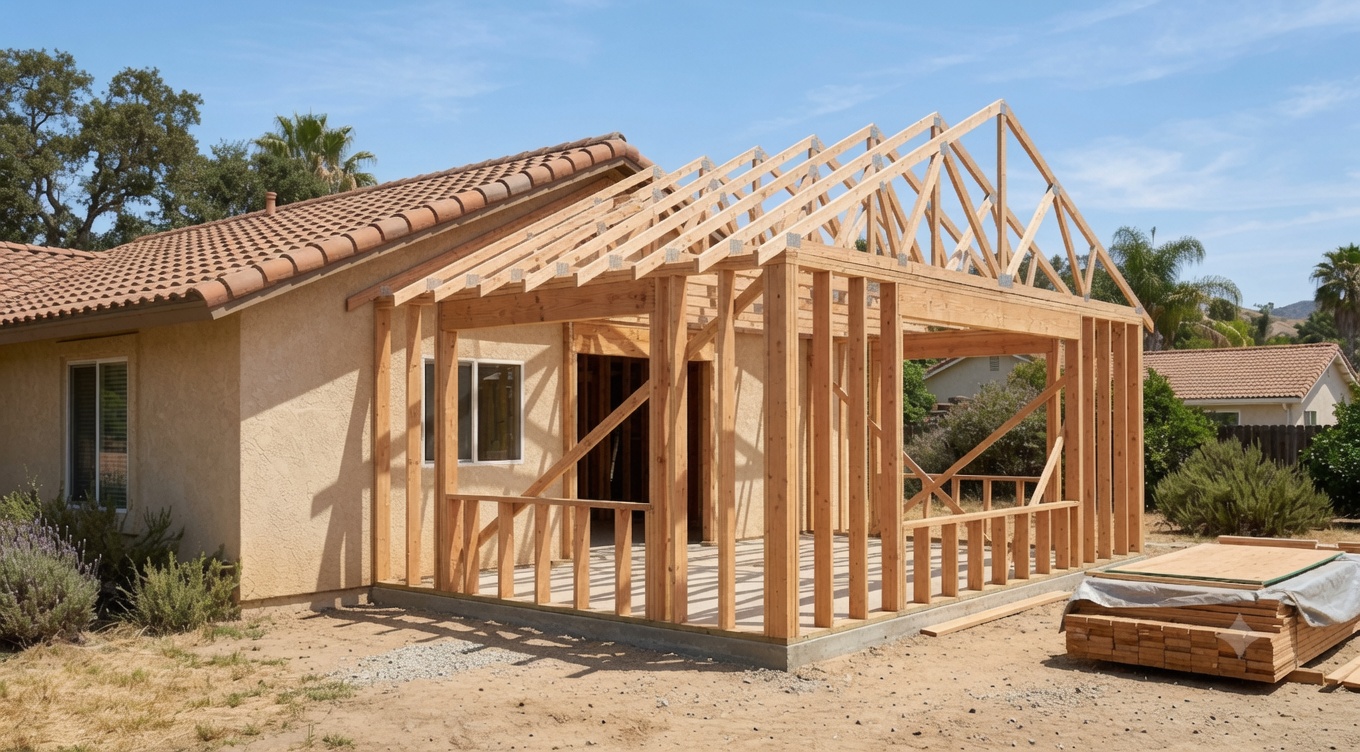
Quick Answer
Does remodeling raise your property taxes in California? Only if the work counts as new construction. Under Proposition 13, the assessor reassesses just the new portion, never the whole home. A room addition or an ADU is assessable, but normal maintenance and like-for-like replacement is not.
Property tax rules verified as of July 27, 2026. Sources: the Revenue and Taxation Code, the Board of Equalization, and the Orange County Assessor. Analysis by Michael Mellgren, REALTOR® (DRE #02321556). General information only, not tax advice.
How Proposition 13 decides what gets reassessed
Proposition 13 sets a base year value for your home. That value rises no more than 2 percent a year, whatever the market does.
Still, only two events reset it. One is a change of ownership, and the other is new construction. A remodel falls under the second.
Here is the part most owners get wrong. New construction does not reassess the whole property. Under section 71, the assessor sets a new base year value for the new portion only. Everything else keeps its old value.
Say a 1994 base year value sits on a Yorba Linda home. Adding a bedroom does not disturb it. That bedroom gets its own value, which is then added on top. Meanwhile, land value does not change at all.
What counts as new construction, and what does not
Section 70 defines new construction two ways. The first is any addition to land or improvements. The second is any alteration that amounts to a major rehabilitation or converts the property to a different use.
Major rehabilitation means work that makes an improvement the substantial equivalent of a new one. By contrast, normal maintenance and repair falls outside all of it. The Board of Equalization publishes examples on both sides. So does the Orange County Assessor’s guidance on new construction.
| Project | Usually assessable | Why |
|---|---|---|
| Room addition or added square footage | Yes | An addition to improvements under section 70 |
| New ADU, or a garage converted to living area | Yes | Adds living area and converts the space to a different use |
| Pool, spa, deck, patio cover, or flatwork | Yes | Outdoor additions are additions to improvements |
| Tear-down and rebuild | Yes | The structure is new in its entirety, even if one wall stands |
| Rehabilitation of framing, foundation, plumbing, or wiring | Usually | Structural work that extends the building’s usable life |
| Roof replacement, like for like | No | Normal maintenance and repair |
| Paint, carpet, or wall coverings | No | Cosmetic work that adds no square footage |
| Swapping a heater, water lines, or windows for similar items | No | Replacement of existing items of similar size and purpose |
How California assessors generally treat common residential projects. Sources: Revenue and Taxation Code section 70, the Board of Equalization, and the Orange County Assessor; analysis by Michael Mellgren, REALTOR®.
The tear-down rule catches people out
Leaving one wall standing does not help. According to the Board of Equalization, a rebuilt house counts as new construction in its entirety, whatever survives on site. So only the land keeps its old assessed value.
There is a partial offset, at least. The value added by the new house is measured against the assessed value of the home that came down.
Does remodeling raise your property taxes on a kitchen or bathroom?
It depends, and the two authorities read differently. The Board of Equalization lists kitchen and bathroom work as assessable in several cases:
- Structural changes, or a changed floor plan.
- Upgraded plumbing or wiring.
- Added size.
- Cabinets, counters, flooring, or fixtures replaced with upgraded materials.
Orange County reads it more narrowly. The Assessor’s own guidance says remodeling is generally not assessable unless it adds square footage. That guidance names countertops, cabinets, carpeting, and windows as cosmetic.
Both can hold, because the call is local. The Board of Equalization says a county assessor decides case by case. The test is whether the room is now the equivalent of a new one. So for an Orange County address, the county’s own guidance governs.
A practical read follows. Swapping finishes rarely triggers anything. Moving walls, adding square footage, or rebuilding the plumbing and wiring usually does.
How much does the tax actually go up?
The increase tracks market value added, not what the project cost. That distinction comes from the Board of Equalization itself, and it cuts both ways. A $200,000 remodel that adds $120,000 of value is assessed on the $120,000.
After that the math is ordinary. The new value joins your assessed value. Tax then runs at the Proposition 13 base rate of 1 percent. Voter-approved debt and direct levies already on your bill apply on top.
Worked example
A homeowner carries a base year value of $420,000 and builds a detached ADU. On completion, the assessor determines the ADU added $180,000 of market value.
That $180,000 becomes its own base year value and joins the $420,000, for $600,000 total. The original $420,000 is untouched and keeps its 2 percent cap. At the 1 percent base rate, the added tax runs about $1,800 a year, before voter-approved debt and direct levies.
The supplemental bill nobody expects
Completed construction also triggers a one-time supplemental assessment. It is prorated from the first day of the month after completion to the end of the fiscal year. That year runs July 1 to June 30.
Also, completion means available for use, not the day the last invoice clears. In Orange County, work finished on May 15 carries a supplemental effective date of June 1.
That bill arrives separately from the annual one. A purchase produces the same kind of bill for a different reason. This guide to closing costs in Orange County covers that version.
Which improvements are excluded from reassessment?
State law excludes a short list of projects. Several require a claim form, and some carry hard deadlines that are easy to miss.
| Excluded work | Code section | Claim form | Filing window |
|---|---|---|---|
| Active solar energy system | Section 73 | None | Scheduled to sunset January 1, 2027 |
| Fire sprinkler, detection, and extinguishing systems | Section 74 | None | None stated |
| Disabled access work on a home | Section 74.3 | BOE-63 | No stated period |
| Seismic safety retrofitting | Section 74.5 | BOE-64 | Notify within 30 days of completion, documents within six months |
| Rebuilding after a disaster, substantially as before | Section 70(c) | None | None stated |
| Cleanup of environmentally contaminated property | Section 74.7 | Required | Notify by 30 days after completion, documents within six months |
New construction exclusions most often reaching California homeowners. Source: California State Board of Equalization, with the Revenue and Taxation Code sections cited; analysis by Michael Mellgren, REALTOR®.
Every exclusion has the same catch
An exclusion protects the owner who did the work. Even so, it does not shield the property forever. Per the Board of Equalization, excluded value reaches the assessment at the next change of ownership. A new base year value gets set then.
So solar you install stays excluded while you own the home. Once the home sells, the buyer’s assessment rests on the purchase price, and that price includes the panels.
The solar exclusion is on a clock
Section 73 is scheduled to sunset on January 1, 2027. A system completed before that date keeps the exclusion until the next change of ownership, which the statute states directly.
In fact, lawmakers have extended this deadline repeatedly since 1980. However, a 2026 bill to extend it again was held in committee on May 14, 2026. So the sunset stands as of this writing, and anyone planning an installation should confirm the current status first.
Does the assessor find out without a permit?
Usually, yes. State law requires cities and counties to send the assessor copies of building permits. Pulling one therefore puts the project in front of the Assessor by itself.
Still, skipping the permit does not solve the problem. The Board of Equalization states that the assessor must value new construction whether or not a permit issued. Discovery also comes from aerial photographs, satellite imagery, routine field inspections, and what surfaces when a property sells.
Unpermitted work then carries its own trouble at resale. Appraisers often exclude it from square footage, lenders can balk, and California disclosure duties still apply. This step-by-step guide to how to sell a home in Orange County covers where disclosures land.
Property tax and income tax pull in opposite directions
One remodel can move two different taxes at once. For property tax, an assessable improvement raises the bill every year you own the home.
For income tax at sale, that same improvement raises your basis, which shrinks the taxable gain. Repairs do neither. This guide to capital gains tax when selling a California home sets out which costs count toward basis.
Frequently asked questions: does remodeling raise your property taxes?
Does painting or new flooring raise property taxes?
No. Cosmetic work counts as normal maintenance, and the Orange County Assessor names carpeting and paint as examples. So nothing is added to your assessed value.
Does a new roof raise property taxes?
Not when it replaces the old one like for like. The Board of Equalization treats swapping a shake roof for tile as routine maintenance. Any added market value is therefore not assessable. Replacement items should be similar in size and purpose to the ones removed.
Does an ADU trigger a full reassessment of the house?
No. Only the ADU is valued, and that figure is added to your existing assessed value. The main home keeps its base year value and its 2 percent annual cap.
Does remodeling raise your property taxes if you do the work yourself?
It makes no difference. The assessor values the market value the work added, not the labor bill and not who swung the hammer. Sweat equity lowers your cost, though it does not lower the assessment.
Can you appeal a new construction assessment?
Yes. In Orange County you get 60 days from the mailing of the Notice of Supplemental Assessment. File with the Clerk of the Board of Supervisors. Filing does not pause the due date, so pay the bill and pursue a refund.
Weighing a project on a North Orange County home?
The tax question and the resale question are separate questions, and both belong in the decision before a contractor starts. Michael Mellgren, REALTOR®, follows the North Orange County market closely. He can talk through how a planned project is likely to land at resale. He can also flag what to confirm with the Assessor first.
Email Michael Mellgren about a remodel and property taxes, or call or text (714) 420-6629. For the assessment on a specific address, contact the Orange County Assessor. For the tax treatment of a project, consult a qualified tax professional.